This site uses cookies to improve your experience. To help us insure we adhere to various privacy regulations, please select your country/region of residence. If you do not select a country, we will assume you are from the United States. Select your Cookie Settings or view our Privacy Policy and Terms of Use.
Cookie Settings
Cookies and similar technologies are used on this website for proper function of the website, for tracking performance analytics and for marketing purposes. We and some of our third-party providers may use cookie data for various purposes. Please review the cookie settings below and choose your preference.
Used for the proper function of the website
Used for monitoring website traffic and interactions
Cookie Settings
Cookies and similar technologies are used on this website for proper function of the website, for tracking performance analytics and for marketing purposes. We and some of our third-party providers may use cookie data for various purposes. Please review the cookie settings below and choose your preference.
Strictly Necessary: Used for the proper function of the website
Performance/Analytics: Used for monitoring website traffic and interactions
In todays data-driven world, securely accessing, visualizing, and analyzing data is essential for making informed business decisions. For instance, a global sports gear company selling products across multiple regions needs to visualize its sales data, which includes country-level details.
OpenSearch Service stores different types of stored objects, such as dashboards, visualizations, alerts, security roles, index templates, and more, within the domain. As your user base and number of Amazon OpenSearch Service domains grow, tracking activities and changes to those saved objects becomes increasingly difficult.
“Bigdata is at the foundation of all the megatrends that are happening.” – Chris Lynch, bigdata expert. We live in a world saturated with data. Zettabytes of data are floating around in our digital universe, just waiting to be analyzed and explored, according to AnalyticsWeek. At present, around 2.7
You can navigate to the projects Data page to visually verify the existence of the newly created table. On the top left menu, choose your project name, and under CURRENT PROJECT , choose Data. Additionally, the notebook provides a chart view to visualize query results as graphs. Under Create job , choose Visual ETL.
Create an ETL job to ingest data from SAP In the AWS Glue console, create a new Visual Editor AWS Glue job. In the navigation pane under ETL Jobs choose Visual ETL. Choose Visual ETL to create a job in the Visual Editor. On your Visual Editor canvas, select your SAP sources. Go to the AWS Glue console.
We are excited to announce a new capability of the AWS Glue Studio visual editor that offers a new visual user experience. Now you can author data preparation transformations and edit them with the AWS Glue Studio visual editor. You can configure all these steps in the visual editor in AWS Glue Studio.
In fact, a Digital Universe study found that the total data supply in 2012 was 2.8 Based on that amount of data alone, it is clear the calling card of any successful enterprise in today’s global world will be the ability to analyze complex data, produce actionable insights and adapt to new market needs… all at the speed of thought.
“Without bigdata, you are blind and deaf and in the middle of a freeway.” – Geoffrey Moore, management consultant, and author. In a world dominated by data, it’s more important than ever for businesses to understand how to extract every drop of value from the raft of digital insights available at their fingertips.
Data precision has completely revamped our understanding of geography in countless ways. We also use bigdata to facilitate navigation. One of the tools that utilizes bigdata is Google Maps. The Emerging Role of BigData with Google Analytics. When to use a radius on a map.
Modern marketing strategies rely heavily on bigdata. One study found that retailers that use bigdata have 2.7 Bigdata is even more important for companies that depend on social media marketing. His statement about the importance of bigdata in social media marketing is even more true today.
This feature is part of the Amazon Redshift console and provides a visual and graphical representation of the query’s run order, execution plan, and various statistics. The Query profiler is a graphical tool that helps users analyze the components and performance of a query.
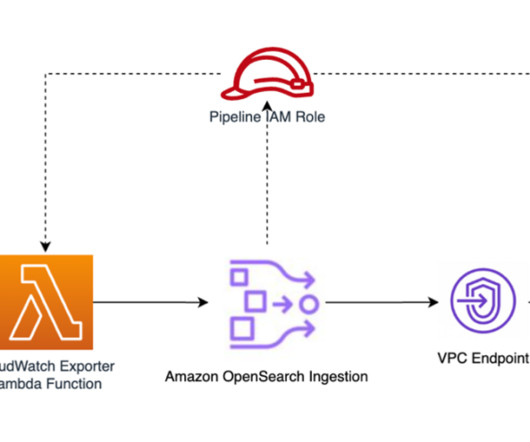
The Ingestion pipeline is responsible for processing and enriching the log data received from the CloudWatch exporter Lambda function before storing it in the OpenSearch Serverless collection. OpenSearch Service : This is fully managed service that stores and indexes log data, making it searchable and available for analysis and visualization.
Companies are spending nearly $30 billion a year on bigdata for marketing initiatives. One of the many reasons that they are using bigdata is to create better content marketing strategies. Despite the many benefits of bigdata for content marketing, many businesses still don’t know how to utilize it effectively.
Whether it’s customer information, sales records, or sensor data from Internet of Things (IoT) devices, the importance of handling and storing data at scale with ease of use is paramount. A common use case that we see amongst customers is to search and visualizedata.
Manage your Iceberg table with AWS Glue You can use AWS Glue to ingest, catalog, transform, and manage the data on Amazon Simple Storage Service (Amazon S3). With AWS Glue, you can discover and connect to more than 70 diverse data sources and manage your data in a centralized data catalog.
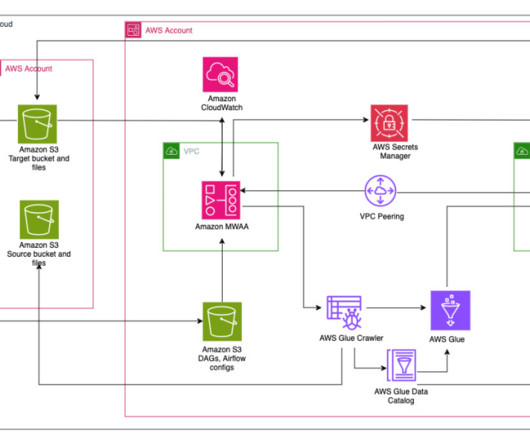
Add this policy to the AWS Glue role and Amazon MWAA role: { "Version": "2012-10-17", "Statement": [ { "Effect": "Allow", "Action": [ "s3:GetObject", "s3:PutObject", "s3:PutObjectAcl" ], "Resource": "arn:aws:s3:::sample-inp-bucket-etl- /*" } ] } In Account B, create the IAM policy policy_for_roleB specifying Account A as a trusted entity.
Replace the placeholder with the S3 bucket name you created earlier: { "Version": "2012-10-17", "Statement": [ { "Effect": "Allow", "Action": "s3:GetObject", "Resource": [ "arn:aws:s3::: /*" ] } ] } Next, we create one of the AWS Glue ETL jobs, ruleset-5. On the AWS Glue console, under ETL jobs in the navigation pane, choose Visual ETL.
AWS Data Pipeline helps customers automate the movement and transformation of data. With Data Pipeline, customers can define data-driven workflows, so that tasks can be dependent on the successful completion of previous tasks. You can visually create, run, and monitor ETL pipelines to load data into your data lakes.
Snapshot Management helps you create point-in-time backups of your domain using OpenSearch Dashboards, including both data and configuration settings (for visualizations and dashboards). Starting with OpenSearch v2.5
Background At AWS Payments, we had been using Redash to allow our users to author and run SQL queries against our Amazon Redshift data warehouse. Redash is a web-based SQL client application that can be used to author and run queries, visualize query results with charts, and collaborate with teams.
Amazon Redshift provides a web-based Query Editor V2 in addition to supporting connectivity via ODBC/JDBC or the Amazon Redshift Data API. Amazon Redshift Query Editor V2 makes it easy to query your data using SQL and gain insights by visualizing your results using charts and graphs with a few clicks.
Then to perform more complex data analysis such as regression tests and time series forecasting, you can use Apache Spark with Python, which allows you to take advantage of a rich ecosystem of libraries, including datavisualization in Matplot, Seaborn, and Plotly.
AWS Glue is a serverless data integration service that makes it straightforward to discover, prepare, and combine data for analytics, machine learning (ML), and application development. AWS Glue provides both visual and code-based interfaces to make data integration effortless. Choose Create job and Visual ETL.
To interact with and analyze data stored in Amazon Redshift, AWS provides the Amazon Redshift Query Editor V2 , a web-based tool that allows you to explore, analyze, and share data using SQL. The Query Editor V2 offers a user-friendly interface for connecting to your Redshift clusters, executing queries, and visualizing results.
to create forecast tables and visualize the data. To show this capability, we demonstrate two use cases: Forecast electricity consumption by customer Predict bike sharing rentals What is time series data? Time series data is any dataset that collects information at various time intervals.
In the current trend of bigdata, datavisualization has become an interactive display mode that everyone admires. The picture below shows the characteristics of the excellent dashboard that Stephen Few listed in the Dashboard Graphic Design Competition in 2012. Prepare a datavisualization tool.
Data Prepper is part of the open source OpenSearch project. With OpenSearch Ingestion, you can filter, enrich, transform, and deliver your data for downstream analysis and visualization. You configure your data producers to send data to OpenSearch Ingestion.
Scott whisked us through the history of business intelligence from its first definition in 1958 to the current rise of BigData. Scott outlined how this change has driven a shift in the role of data teams , who now occupy strategic business positions. From a startup in 2012, it is now valued at $3.2 A true unicorn.
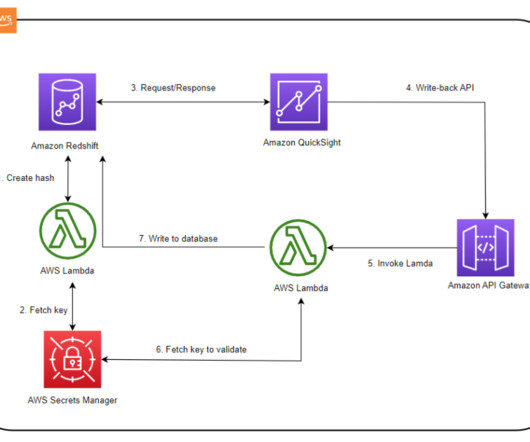
A write-back is the ability to update a data mart, data warehouse, or any other database backend from within BI dashboards and analyze the updated data in near-real time within the dashboard itself. . # The following screenshot shows a sample table visual. See [link] # We rethrow the exception by default.
In the first part of this post, we walk through the integration between AWS Glue Data Quality and Amazon DataZone. We discuss how to visualizedata quality scores in Amazon DataZone, enable AWS Glue Data Quality when creating a new Amazon DataZone data source, and enable data quality for an existing data asset.
Switch from Visual to JSON mode and enter the following JSON on the textbox. In this example, we use an ETL script job; for a visual job, because it generates the script automatically on save, the Airflow role would need permission to write to the configured script path on Amazon Simple Storage Service (Amazon S3).
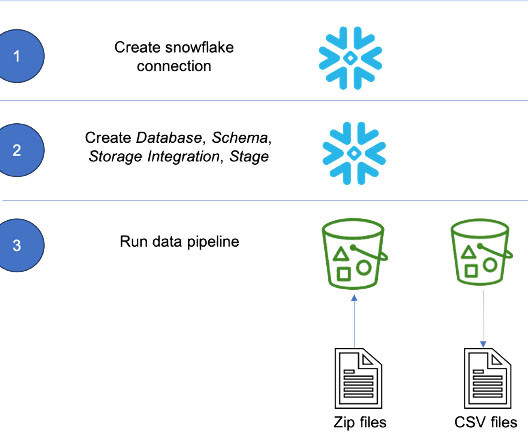
Configure access permissions for the S3 bucket While creating the IAM policy, a sample policy document code is needed (see the following code), which provides Snowflake with the required permissions to load or unload data using a single bucket and folder path. The bucket name used in this post is citibike-tripdata-destination-ACCOUNT_ID.
Visual layouts in some screenshots in this post may look different than those on your AWS Management Console. Data generation In this section, we discuss the steps to manually or automatically generate journey data. Refer to the instructions in the README file for steps on how to provision and decommission this solution.
In the dialog box that appears, enter the data format yyyy-MM-dd'T'HH:mm:ssZZ. Choose PUBLISH & VISUALIZE. This will take you to the visualization page to create the analysis on QuickSight. Create a governance dashboard with the appropriate visualization type. Delete the Athena data source for DynamoDB.
It includes perspectives about current issues, themes, vendors, and products for data governance. My interest in data governance (DG) began with the recent industry surveys by O’Reilly Media about enterprise adoption of “ABC” (AI, BigData, Cloud). We keep feeding the monster data. the flywheel effect.
You can continuously load fresh data by calling the stored procedure at regular intervals. Establish connectivity between an Amazon QuickSight dashboard and Amazon Redshift to deliver visualization and insights.
Consider using Amazon EMR Studio notebooks to interact with your Amazon Redshift data in your Apache Spark application. Consider using AWS Glue Studio to create Apache Spark jobs using a visual interface. enableHiveSupport().getOrCreate() Gagan has over 18 years of experience in information technology.
Dalam tren bigdata saat ini, visualisasi data di layar besar telah menjadi sebuah mode tampilan interaktif yang setiap orang kagumi. Gambar di bawah ini menunjukkan karakteristik dashboard yang sangat baik yang dicantumkan Stephen Few di Kompetisi Desain Grafik Dashboard 2012.
He’s been out of Wolfram for a while and writing exquisite science books including Elements: A Visual Explanation of Every Known Atom in the Universe and Molecules: The Architecture of Everything. Historically, grad students in physics and physical sciences have been excellent candidates for data science teams. Or something.
After successfully uploading the templates, download the pre-built dashboards and other components required to visualize the Security Lake data in OpenSearch indices. All the necessary index and component templates, index patterns, visualizations, and dashboards are now successfully installed.
However, AI capabilities have been evolving steadily since the breakthrough development of artificial neural networks in 2012, which allow machines to engage in reinforcement learning and simulate how the human brain processes information. Human intervention was required to expand Siri’s knowledge base and functionality.
In this post, we show how to process XML data using AWS Glue and Athena. This approach provides a user-friendly interface and is particularly suitable for individuals who prefer a graphical approach to managing their data. Under Create job , select Visual with a blank canvas. Choose Create. Rename the job to blog_glue_xml_job.
Her talk addressed career paths for people in data science going into specialized roles, such as datavisualization engineers, algorithm engineers, and so on. If your business is using bigdata and putting dashboards in front of analysts, you’re missing the point.”. Being model-driven is like using GPS.”. “If
Data Prepper is part of the open-source OpenSearch project. With OpenSearch Ingestion, you can filter, enrich, transform, and deliver your data for downstream analysis and visualization. Create a trust relationship to allow Fluent Bit to assume the ingestion role, as shown in the following code.
We organize all of the trending information in your field so you don't have to. Join 42,000+ users and stay up to date on the latest articles your peers are reading.
You know about us, now we want to get to know you!
Let's personalize your content
Let's get even more personalized
We recognize your account from another site in our network, please click 'Send Email' below to continue with verifying your account and setting a password.


Let's personalize your content