Remove 2012 Remove Dashboards Remove Interactive
article thumbnail

How Can Beginners Create a Great Dashboard?

FineReport

In the current trend of big data, data visualization has become an interactive display mode that everyone admires. And dashboards are widely used to display business performance in enterprises. So how can we create a good dashboard, especially for beginners? This time I plan to create a simple salesperson performance dashboard.

article thumbnail

Performance Dashboard: Facilitate The Performance of Your Business

FineReport

Performance dashboard can help you deal with various business problems. What is a performance dashboard? Companies can use performance dashboards to guide various indicators, ranging from checking the ability of a department to monitoring the availability of business strategies for global organizations.

Insiders

Sign Up for our Newsletter

This site is protected by reCAPTCHA and the Google Privacy Policy and Terms of Service apply.

article thumbnail

Level up your React app with Amazon QuickSight: How to embed your dashboard for anonymous access

AWS Big Data

There are multiple ways to embed QuickSight dashboards into application. Dashboard consumers often don’t have a user assigned to their AWS account and therefore lack access to the dashboard. To enable them to consume data, the dashboard needs to be accessible for anonymous users. Choose Create policy.

article thumbnail

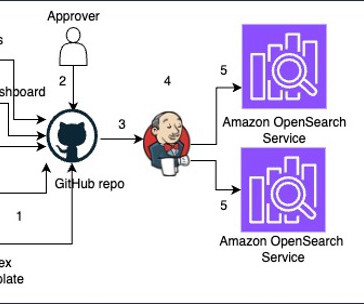
Manage Amazon OpenSearch Service Visualizations, Alerts, and More with GitHub and Jenkins

AWS Big Data

It allows organizations to secure data, perform searches, analyze logs, monitor applications in real time, and explore interactive log analytics. OpenSearch Service stores different types of stored objects, such as dashboards, visualizations, alerts, security roles, index templates, and more, within the domain.

article thumbnail

A Guide To The Methods, Benefits & Problems of The Interpretation of Data

datapine

6) The Use of Dashboards For Data Interpretation. In fact, a Digital Universe study found that the total data supply in 2012 was 2.8 Business dashboards are the digital age tools for big data. After its implementation in 2012, Intel saved over $3 million in manufacturing costs. trillion gigabytes!

article thumbnail

Ingest and analyze your data using Amazon OpenSearch Service with Amazon OpenSearch Ingestion

AWS Big Data

In this post, we show how to ingest CSV files from Amazon Simple Storage Service (Amazon S3) into Amazon OpenSearch Service using the Amazon OpenSearch Ingestion feature and visualize the ingested data using OpenSearch Dashboards. Additionally, we demonstrate how to visualize the ingested data using OpenSearch Dashboards.

article thumbnail

Introduction To The Basic Business Intelligence Concepts

datapine

A host of business intelligence concepts are executed through intuitive, interactive tools and dashboards – a centralized space that provides the ability to drill down into your data with ease. Data dashboarding and reporting. 4) Data dashboarding and reporting. But more on that later. followed by 18 zeros.