This site uses cookies to improve your experience. To help us insure we adhere to various privacy regulations, please select your country/region of residence. If you do not select a country, we will assume you are from the United States. Select your Cookie Settings or view our Privacy Policy and Terms of Use.
Cookie Settings
Cookies and similar technologies are used on this website for proper function of the website, for tracking performance analytics and for marketing purposes. We and some of our third-party providers may use cookie data for various purposes. Please review the cookie settings below and choose your preference.
Used for the proper function of the website
Used for monitoring website traffic and interactions
Cookie Settings
Cookies and similar technologies are used on this website for proper function of the website, for tracking performance analytics and for marketing purposes. We and some of our third-party providers may use cookie data for various purposes. Please review the cookie settings below and choose your preference.
Strictly Necessary: Used for the proper function of the website
Performance/Analytics: Used for monitoring website traffic and interactions
In todays data-driven world, securely accessing, visualizing, and analyzing data is essential for making informed business decisions. For instance, a global sports gear company selling products across multiple regions needs to visualize its sales data, which includes country-level details. A Python virtual environment.
For several years, Visual Studio has been my go-to tool for designing semantic data models used for Business Intelligent reporting. Back in 2005, I used the Business Intelligence Development Studio (BIDS) Visual Studio add-in for SSIS, SSRS and SSAS projects to develop BI solutions with multidimensional cubes.
OpenSearch Service stores different types of stored objects, such as dashboards, visualizations, alerts, security roles, index templates, and more, within the domain. As your user base and number of Amazon OpenSearch Service domains grow, tracking activities and changes to those saved objects becomes increasingly difficult.
Less is often more when designing your data visualizations. www.forbes.com/special-report/2012/annoying-business-jargons-12.html. Individual visualizations quickly become difficult to interpret when many dimensions are shown simultaneously. Make your own beautiful visualizations. Reduce chart junk. Reduce pie charts.
In fact, a Digital Universe study found that the total data supply in 2012 was 2.8 Through the art of streamlined visual communication, data dashboards permit businesses to engage in real-time and informed decision-making and are key instruments in data interpretation. trillion gigabytes! agree, strongly agree, disagree, etc.).
We are excited to announce a new capability of the AWS Glue Studio visual editor that offers a new visual user experience. Now you can author data preparation transformations and edit them with the AWS Glue Studio visual editor. You can configure all these steps in the visual editor in AWS Glue Studio.
You can navigate to the projects Data page to visually verify the existence of the newly created table. Additionally, the notebook provides a chart view to visualize query results as graphs. Lets try a quick visualization to analyze the rating distribution. Under Create job , choose Visual ETL. option("url", jdbcurl).option("dbtable",
Create an ETL job to ingest data from SAP In the AWS Glue console, create a new Visual Editor AWS Glue job. In the navigation pane under ETL Jobs choose Visual ETL. Choose Visual ETL to create a job in the Visual Editor. On your Visual Editor canvas, select your SAP sources. Go to the AWS Glue console.
Visualizing data in charts, graphs, dashboards, and infographics is one of the most powerful strategies for getting your numbers out of your spreadsheets and into real-world conversations. But it can be overwhelming to get started with data visualization. If so, this step-by-step data visualization guide is for you!
We gave you a curated list of our top 15 data analytics books , top 18 data visualization books , top 16 SQL books – and, as promised, we’re going to tell you all about the world’s best books on data science. 8) “Storytelling With Data: A Data Visualization Guide for Business Professionals” by Cole Nussbaumer Knaflic.
Business intelligence concepts refer to the usage of digital computing technologies in the form of data warehouses, analytics and visualization with the aim of identifying and analyzing essential business-based data to generate new, actionable corporate insights. They enable powerful data visualization. followed by 18 zeros.
Whether you’re locating parks within a five-mile radius or visually communicating the areas in which your business provides service, a radius tool can provide additional organization to your search. In 2012, Google boasted about its capabilities of using big data to create storytelling via interactive maps.
While this visualisation technique is a variation of the classic Box Plot , a Functional Box Plot is visually very different and instead plots a combination of lines and areas to communicate the various data ranges. 2012, Environmetrics, 23: 54-64. and Genton, M.G., link] Functional boxplots for multivariate curves Sun, Y.
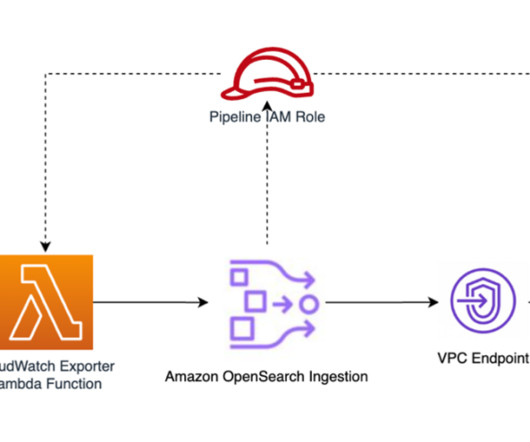
OpenSearch Service : This is fully managed service that stores and indexes log data, making it searchable and available for analysis and visualization. This integration uses CloudWatch for log aggregation, Lambda for log processing, and OpenSearch Serverless for querying and visualization. Choose Roles, and then choose Create role.
There’s recognition that it’s nearly impossible to find the unicorn data scientist that was the apple of every CEO’s eye in 2012. Some companies are starting to segregate the responsibilities of the unicorn data scientist into multiple roles (data engineer, ML engineer, ML architect, visualization developer, etc.),
Arc Diagrams: Visualizing Structure in Strings (2002) By Martin Wattenberg Topic: Data Visualisation. Thread Arcs: an email thread visualization (2003) By Bernard Kerr Topic: Data Visualisation. R-CHIE : a web server and R package for visualizing RNA secondary structures (2012) By Daniel Lai, Jeff R. Wiebe and Irmtraud M.
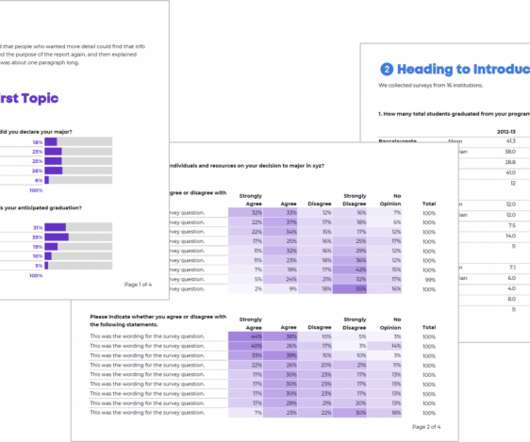
Here’s what tables in the back of reports typically look like: Tiny font sizes, cluttered tables, and no visuals to help readers spot the key patterns. Introducing… Visual Appendices! Here’s my wish for your next report: Visual appendices! Third, add visuals! 3 Quick Visuals to Include in Appendices.
A common use case that we see amongst customers is to search and visualize data. In this post, we show how to ingest CSV files from Amazon Simple Storage Service (Amazon S3) into Amazon OpenSearch Service using the Amazon OpenSearch Ingestion feature and visualize the ingested data using OpenSearch Dashboards.
He joined the league in 2012 as its first sustainability director with a mandate to find ways to embed sustainable business practices across the league and its member clubs. Data reporting and insights: A visualization dashboard shows environmental, consumption, and financial metrics. SAP is the technical lead on NHL Venue Metrics.
This feature is part of the Amazon Redshift console and provides a visual and graphical representation of the query’s run order, execution plan, and various statistics. The Query profiler is a graphical tool that helps users analyze the components and performance of a query.
He hypothesised that VR might deliver massive and complex information to the pattern recognition engine of the human brain via the visual cortex, to amplify human intelligence (IA), and that would be at least as important as AI. I do believe that one day business will commonly be conducted in a fully immersive 3D visual metaverse.
We have already given you our top data visualization books , top business intelligence books , and best data analytics books. This piece, published in 2012, offers a step-to-step guide on everything related to SQL. Its visually rich format is designed for the way your brain works, not in a text-heavy approach that puts you to sleep.
Geoffrey Moore tweeted about this in 2012 when he said: “Without big data analytics, companies are blind and deaf, wandering out onto the Web like deer on a freeway.”. It’s a free online design tool that’s perfect for creating all sorts of visuals, including Instagram highlight covers.
Snapshot Management helps you create point-in-time backups of your domain using OpenSearch Dashboards, including both data and configuration settings (for visualizations and dashboards). Starting with OpenSearch v2.5
Redash is a web-based SQL client application that can be used to author and run queries, visualize query results with charts, and collaborate with teams. Background At AWS Payments, we had been using Redash to allow our users to author and run SQL queries against our Amazon Redshift data warehouse.
SSRS is a server-based reporting platform that comes free with SQL Server 2012. It helps in transforming enterprise data into rich visuals. Migrating SSRS 2012/2014/2016 to Power BI is fine. For simple SSRS reports, it is not hard to move the queries over to Power BI and then reproduce the same visuals (tables, charts, etc).
AWS Glue provides both visual and code-based interfaces to make data integration effortless. You can now use data stored in OpenSearch Service indexes as a source or target within the AWS Glue Studio no-code, drag-and-drop visual interface or directly in an AWS Glue ETL job script. Choose Create job and Visual ETL.
The New York Times 2012 US Presidential election results by State. Czech parliamentary elections 2010 — Peter Ondrejka 2010 / Wikipedia World Map of Economic Growth, Predicted Growth Rate (%) Annually to 2024. This World Map Shows the Economic Growth Over the Coming Decade — howmuch.net Op-Chart: How Much Is Your Vote Worth?
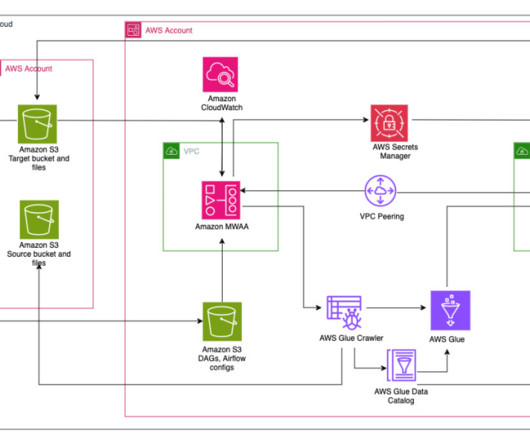
Add this policy to the AWS Glue role and Amazon MWAA role: { "Version": "2012-10-17", "Statement": [ { "Effect": "Allow", "Action": [ "s3:GetObject", "s3:PutObject", "s3:PutObjectAcl" ], "Resource": "arn:aws:s3:::sample-inp-bucket-etl- /*" } ] } In Account B, create the IAM policy policy_for_roleB specifying Account A as a trusted entity.
With OpenSearch Ingestion, you can filter, enrich, transform, and deliver your data for downstream analysis and visualization. You can now analyze infrequently queried data in cloud object stores and simultaneously use the operational analytics and visualization capabilities of OpenSearch Service.
Replace the placeholder with the S3 bucket name you created earlier: { "Version": "2012-10-17", "Statement": [ { "Effect": "Allow", "Action": "s3:GetObject", "Resource": [ "arn:aws:s3::: /*" ] } ] } Next, we create one of the AWS Glue ETL jobs, ruleset-5. On the AWS Glue console, under ETL jobs in the navigation pane, choose Visual ETL.
Launched in 2012, Data Pipeline predates several popular Amazon Web Services (AWS) offerings for orchestrating data pipelines such as AWS Glue , AWS Step Functions , and Amazon Managed Workflows for Apache Airflow (Amazon MWAA). You can visually create, run, and monitor ETL pipelines to load data into your data lakes. Choose ETL jobs.
The Pollster estimate for the 2012 presidential election. Tools to generate this chart with: ArcGIS bertin.js js Datawrapper R (ggplot2, cartogram, sf) Scimago Graphica Vega Examples An Atlas Of Pollution: The World In Carbon Dioxide Emissions. Infographic List A Map of Olympic Medals. Olympics — The New York Times Romney vs. Obama (U.S.)
In the current trend of big data, data visualization has become an interactive display mode that everyone admires. The picture below shows the characteristics of the excellent dashboard that Stephen Few listed in the Dashboard Graphic Design Competition in 2012. Prepare a data visualization tool. Set dashboard body. comparison.
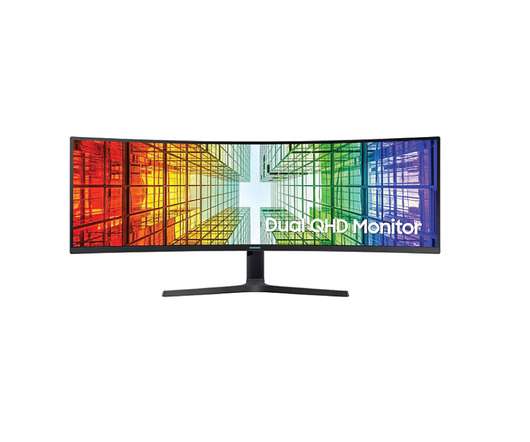
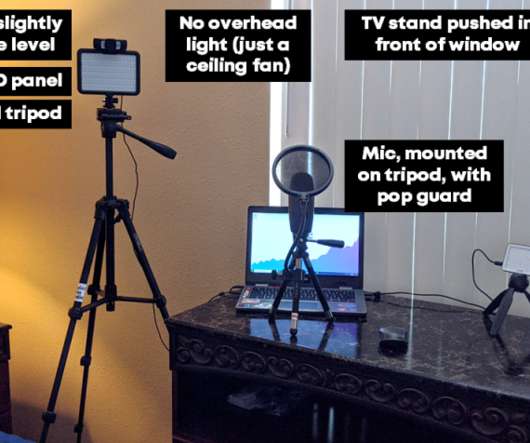
For example, IDC data shows that 2021 there was a boom in monitor sales, with the highest volume of monitors shipped since 2012, at 143.6 However, a technology upgrade should be on the cards too, because over the past few years, many employees have effectively upgraded their home spaces, and now employees need to do the same in the office.
For example, IDC data shows that 2021 there was a boom in monitor sales, with the highest volume of monitors shipped since 2012, at 143.6 However, a technology upgrade should be on the cards too, because over the past few years, many employees have effectively upgraded their home spaces, and now employees need to do the same in the office.
In 2012, we wrote this article on using big data for market research , which you may want to look at. It will also help you determine what type of visuals to use – whether realistic illustrations that can be created by using design accessories like Procreate chain link brushes or infographics.
to create forecast tables and visualize the data. Time series data is plottable on a line graph and such time series graphs are valuable tools for visualizing the data. When the model is ready, it can be accessed using SQL from within Amazon Redshift using any business intelligence (BI) tool.
This post is about standard GA reports, but the standard cart/checkout funnel visualization in GA is value deficient. Multi-channel attribution was the flavor of the month for every month in 2012. And just as in 2012 magic pills will be scarce, FUD will be plentiful, and vendors will promise the moon.
AWS Glue is a serverless data integration service that allows you to visually create, run, and monitor extract, transform, and load (ETL) pipelines to load data into your data lakes in Iceberg format. Brian Dolan joined Amazon as a Military Relations Manager in 2012 after his first career as a Naval Aviator.
Then to perform more complex data analysis such as regression tests and time series forecasting, you can use Apache Spark with Python, which allows you to take advantage of a rich ecosystem of libraries, including data visualization in Matplot, Seaborn, and Plotly.
The Query Editor V2 offers a user-friendly interface for connecting to your Redshift clusters, executing queries, and visualizing results. To interact with and analyze data stored in Amazon Redshift, AWS provides the Amazon Redshift Query Editor V2 , a web-based tool that allows you to explore, analyze, and share data using SQL.
Amazon Redshift Query Editor V2 makes it easy to query your data using SQL and gain insights by visualizing your results using charts and graphs with a few clicks. She is passionate about telling stories with data and enjoys creating engaging visuals to unearth actionable insights. Solutions Architect at Amazon Web Services.
You might recognize Jon from our earlier interview about tips for doing and teaching data visualization in cultures other than your own. Which Data Visualization Trends Are Here to Stay? I have learned so much about developing online data visualization training. Want to skim the highlights from our discussion? Keep reading!
We organize all of the trending information in your field so you don't have to. Join 42,000+ users and stay up to date on the latest articles your peers are reading.
You know about us, now we want to get to know you!
Let's personalize your content
Let's get even more personalized
We recognize your account from another site in our network, please click 'Send Email' below to continue with verifying your account and setting a password.


Let's personalize your content