Chart Snapshot: Box-Percentile Plots
The Data Visualisation Catalogue
MAY 6, 2024
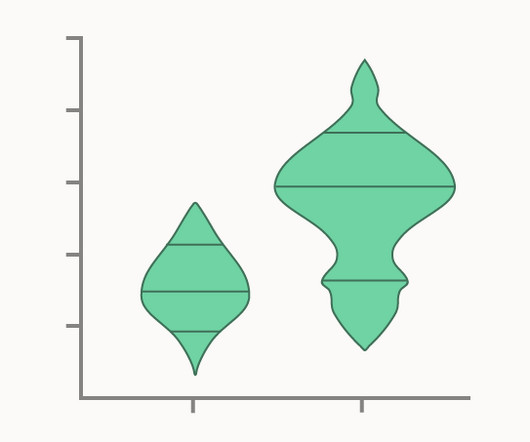
The clear display of a density shape allows for the skewness, modality, and other distributional characteristics to be revealed visually. A Box-Percentile Plot incorporates a density shape (like on a Violin Plot ) by varying the width of the shape in proportion to the percentiles of the data.


Let's personalize your content