This site uses cookies to improve your experience. To help us insure we adhere to various privacy regulations, please select your country/region of residence. If you do not select a country, we will assume you are from the United States. Select your Cookie Settings or view our Privacy Policy and Terms of Use.
Cookie Settings
Cookies and similar technologies are used on this website for proper function of the website, for tracking performance analytics and for marketing purposes. We and some of our third-party providers may use cookie data for various purposes. Please review the cookie settings below and choose your preference.
Used for the proper function of the website
Used for monitoring website traffic and interactions
Cookie Settings
Cookies and similar technologies are used on this website for proper function of the website, for tracking performance analytics and for marketing purposes. We and some of our third-party providers may use cookie data for various purposes. Please review the cookie settings below and choose your preference.
Strictly Necessary: Used for the proper function of the website
Performance/Analytics: Used for monitoring website traffic and interactions
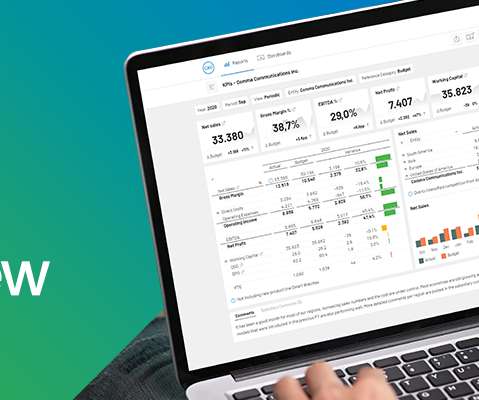
Over the past decade, businessintelligence has been revolutionized. Spreadsheets finally took a backseat to actionable and insightful data visualizations and interactive businessdashboards. 2019 was a particularly major year for the businessintelligence industry. Data exploded and became big.
Bigeye was founded in late 2018 by Chief Executive Officer Kyle Kirwan and Chief Technology Officer Egor Gryaznov. Bigeye’s monitoring capabilities start with automated dependency mapping to identify the source of data used in analytic dashboards and data products, as well as a lineage graph of the data pipeline.
As a matter of fact, Python was declared as the most popular language in 2018 , and it will surely grow in the future as well. There are many differences between businessintelligence and data science, but with the recent development of BI tools, both became closely interconnected and dependent on each other. Let’s get started.
Users open their dashboards expecting every chart to be fully functional and accurate; if they encounter a broken chart, distrust of the dashboard or the underlying data is a natural reaction. However, at a lean startup with a BI team of three, manually checking dozens of dashboards every morning seemed impossible.
Business leaders, developers, data heads, and tech enthusiasts – it’s time to make some room on your businessintelligence bookshelf because once again, datapine has new books for you to add. We have already given you our top data visualization books , top businessintelligence books , and best data analytics books.
In businessintelligence, we are evolving from static reports on what has already happened to proactive analytics with a live dashboard assisting businesses with more accurate reporting. Likewise, 2018 was the year of virtual assistants: Alexa, Cortana, all of them have taken the consumers’ market by storm.
The love for BusinessObjects was in the air at this year’s InfoSol BusinessIntelligence Seminar (IBIS). One of the highlights of IBIS was the InfoSol 2018 Best BI Dashboards Awards. Dashboards continue to be the primary interface of most businessintelligence solutions. Best BusinessDashboard Award.
With the Digital Agenda , the European Union is creating clear and uniform rules for the responsible use of data and artificial intelligence. In addition to the General Data Protection Regulation which went into effect in May 2018 its current focus is on the EU AI Act and the EU Data Act.
Business analytics also involves data mining, statistical analysis, predictive modeling, and the like, but is focused on driving better business decisions. What is the difference between business analytics and businessintelligence? Business analytics dashboard components.
New features for Flow provide users the ability to trigger flows from analytics dashboards, use low code to easily integrate with any system, and interact with flows directly within Slack, where people spend most of their time,” said Patrick Stokes, general manager for Salesforce Platform. This is automation on one unified CRM platform.
For example, in a July 2018 survey that drew more than 11,000 respondents, we found strong engagement among companies: 51% stated they already had machine learning models in production. A dashboard that provides custom views for all principals (operations, ML engineers, data scientists, business owners). images, audio, video.
There are multiple ways to embed QuickSight dashboards into application. Dashboard consumers often don’t have a user assigned to their AWS account and therefore lack access to the dashboard. To enable them to consume data, the dashboard needs to be accessible for anonymous users.
Earlier this year, Microsoft announced it would retire 15 certifications and 44 exams, including MCSA: BI Reporting, which validated data analysts' expertise using Power BI and Excel to visualize data via dashboards and reports. To read this article in full, please click here
The pairing of CXO’s purpose-built, web-based Enterprise Performance Management (EPM) reporting and Longview’s modular suite of integrated products for tax, transfer pricing, close, plan, and consolidation will allow organizations to deliver richer narrative behind their data with built-in commentary and dynamic dashboards. Ashley Yakopec.
Another startup, founded in 2018 in the UK under the name Glas Data, provides a cloud-based agriculture analysis platform that can aggregate data from various sources in the farm and provide insights in the form of dashboard visualizations.
One potential solution to this challenge is to deploy self-service analytics, a type of businessintelligence (BI) that enables business users to perform queries and generate reports on their own with little or no help from IT or data specialists. It’s an asset “that responds to dynamic business requirements.”
Hence in 2018, Petrosea began launching a corporate-wide digital transformation initiative that would result in streamlining and promoting operational efficiency – which also included Minerva Digital Mining, SHEPRO, and a proof of concept of a unified platform for monitoring its ESG performance.
A trend now recognized by Gartner in their 2018 Critical Capabilities for Analytics and BusinessIntelligence Platforms report, more and more organizations see the value in providing their customers with analytics. Typically Best for: Tenants with identical data models and dashboard requirements.
IT-driven sustainability The league released sustainability reports in 2014 and 2018. Data reporting and insights: A visualization dashboard shows environmental, consumption, and financial metrics. “Benchmarking, analyzing, and then showcasing those best practices, that’s the power of this tool,” Mitchell adds.
Following this, in 2002, it began delivering its knowledge to customers in online format, using dashboards and interactive reports that provided easier and faster access to data and analysis. Additionally, it continuously explores reams of data and modern tools to improve its capabilities and adapt to the changing data landscape.
At the IBIS 2018 BusinessObjects event in June, there were a lot of people asking about the future of BusinessObjects Dashboards (aka Xcelsius). years away), SAP has said that it will no longer support BusinessObjects Dashboards after that date. These Xcelsius dashboards have no reliance on Flash for their run-time.
CNN reported that Zillow bought 27,000 homes through Zillow Offers since its launch in April 2018 but sold only 17,000 through the end of September 2021. PHE uses an automated process to transfer COVID-19 positive lab results as a CSV file into Excel templates used by reporting dashboards and for contact tracing. The culprit?
With the potential use cases on the horizon for AI in business, as well as the investment dollars and rate of change currently propelling AI, one thing is clear: you’ll need to get your foundation in place sooner, rather than later, to take advantage of the benefits coming to the business world. But how can you do that?
Multinational data infrastructure company Equinix has been capitalizing on machine learning (ML) since 2018, thanks to an initiative that uses ML probabilistic modeling to predict prospective customers’ likelihood of buying Equinix offerings — a program that has contributed millions of dollars in revenue since its inception.
Then in March, the pandemic hit and hotel activity stopped, but it gave us the chance to accelerate the company’s transformation and digitalization process that started in 2018 with a five-year plan. This plan covers from 2018 to 2023. Our CEO, of course, was very clear about this vision. For us this is fundamental.
Reassuringly, the remainder are more data driven, for example, 30% actively employ businessintelligence and data visualisation tools to drive insight but, even here, the effort is confined to operational silos and so these finance functions fail to take advantage of the synergies provided by a more holistic approach.
To add perspective, since I joined Havmor, the company has grown significantly, but not the workforce, having reduced by 30% compare to our numbers in 2018, thanks to digital innovation and transformation. What are some of the unique data and cybersecurity challenges that Havmor faces as a vast customer-centric business?
IBIS 2018 will offer InfoSol BusinessObjects Certification for the following products. BusinessObjects Web Intelligence. BusinessObjects Dashboards. BusinessObjects IDT (Information Design Tool). BusinessObjects Administration.
Before developers start building analytic apps, data engineers and other experts within their company bring data from different sources into Sisense, cleaning and manipulating it so that users can ask business questions and find insights. Businessintelligence: a quick history. Making BI beautiful and functional.
In 2018 it launched AWS Transit Gateway , the first big evolution in cloud networking. “They often had to do a complex workaround of networking, VPNs, and other components to make the infrastructure work,” he says. AWS, recognizing the growing complexity, has continued to build out its connectivity services.
The sheer amount of data being generated is greater than ever (we hit 18 zettabytes in 2018) and will continue to grow. Using Sisense’s live connector for BigQuery, teams can create powerful real-time queries and dashboards to support their teams looking to make smarter, up-to-the-minute data-driven decisions.
If the new BI solution catches on with good adoption and functionality matches or exceeds BO, then phase out old BO reports/dashboards over time as new enhancement requests come up. www.attendibis.com | June 18-20, 2018 | Carlsbad, CA. www.attendibis.com | June 18-20, 2018 | Carlsbad, CA.
To address these challenges, Al Rabie partnered with 1Direction Global, a top solution provider in Financial and Operational Performance Management and Consulting, and a Gold Business Partner with IBM since 2018. Dashboards and reports The system included reports and dashboards based on deployed budget models.
Recently, FanRuan has been recognized with Honorable Mention in the 2022 Gartner Magic Quadrant for Analytics and BusinessIntelligence Platforms released by the well-known IT research and consulting firm Gartner! Since 2018, FanRuan has been certified by IDC as the No. In 2021, FanRuan had a cumulative revenue of 1.14
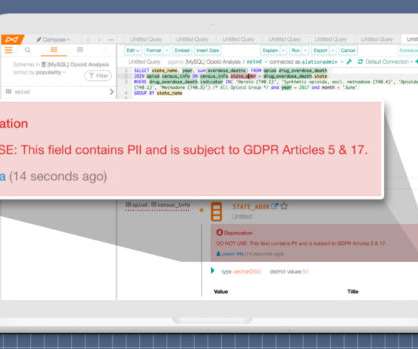
there has to be a business context, and the increasing realization of this context explains the rise of information stewardship applications.” – May 2018 Gartner Market Guide for Information Stewardship Applications. “The key point is that no organization governs information simply because it can. Subscribe to Alation's Blog.
Source: Gartner (April 2018). Any business user or analyst can report on this new metric through a report or dashboard. Idoine, Erick Brethenoux, 12 June 2018. 2 Gartner: Doing Machine Learning Without Hiring (More) Data Scientists, Shubhangi Vashisth, Alexander Linden, 27 April 2018.
Digital brain One milestone for the analytics organization came in late 2018, with a shift in focus away from dashboards and KPIs and toward becoming a digital brain. “We But these were data scientists tinkering with data, producing some insights.” That’s changed in the intervening years, of course.
SSDP (otherwise known as self-serve data preparation) is the logical evolution of businessintelligence analytical tools. With self-serve tools, data discovery and analytics tools are accessible to team members and business users across the enterprise. What is SSDP?
In 2021, FanDuel’s workloads almost tripled since they first started using Amazon Redshift in 2018, and they started evaluating Redshift RA3 nodes vs. DC2 nodes to take advantage of the storage and compute separation and deliver better performance at lower costs.
By 2018, we saw the majority of our customers adopt Apache Kafka as a key part of their streaming ingestion, application integration, and microservice architecture. These data products can be web applications, dashboards, alerting systems, or even data science notebooks. .
“Our strategy in taking a hybrid approach has provided the agility we need to do advanced services in the cloud as we go through our digital transformation,” says Gabriel, who joined the company in 2001 and was promoted to executive vice president and CIO of Clean Harbors in 2018.
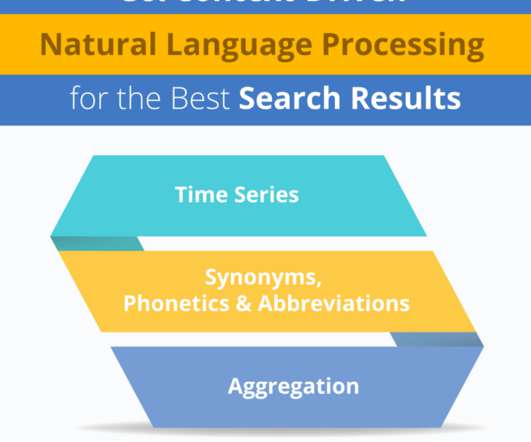
Who sold the most fruit juice in Phonix, Arizona in Christmas of 2018? Who sold the most fruit juice in Phoenix Az in Christmas of 2018? Enter question and the system will recognize and process information correcting for spelling errors, abbreviations and related words. Sample Phonetics-Based Question. Sample Abbreviation Question.
With the potential use cases on the horizon for AI in business, as well as the investment dollars and rate of change currently propelling AI, one thing is clear: you’ll need to get your foundation in place sooner, rather than later, to take advantage of the benefits coming to the business world. But how can you do that?
You’ll also learn how to build interactive dashboards, apply statistical tools and concepts, plan and track Scrum projects, understand business analysis key concepts, analyze data using Tableau, and more. The exam was developed using the Agile Extension to the BABOK guide and was released in May 2018.
We organize all of the trending information in your field so you don't have to. Join 42,000+ users and stay up to date on the latest articles your peers are reading.
You know about us, now we want to get to know you!
Let's personalize your content
Let's get even more personalized
We recognize your account from another site in our network, please click 'Send Email' below to continue with verifying your account and setting a password.


Let's personalize your content