Remove 2018 Remove Interactive Remove Statistics
article thumbnail

Cyber Fraud Statistics & Preventions to Prevent Data Breaches in 2021

Smart Data Collective

In this blog post, we discuss the key statistics and prevention measures that can help you better protect your business in 2021. Cyber fraud statistics and preventions that every internet business needs to know to prevent data breaches in 2021. rose from 38 million in 2016 to over 50 million in 2018.

article thumbnail

5 key areas for tech leaders to watch in 2020

O'Reilly on Data

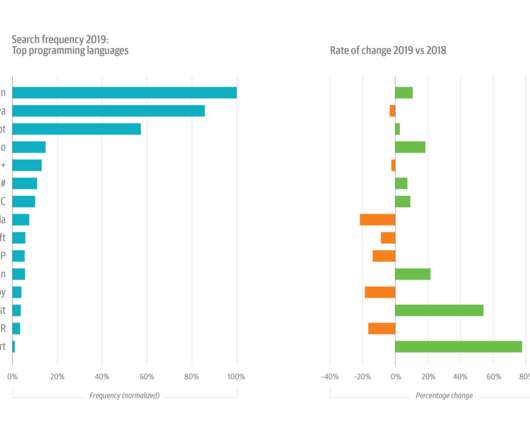
Growth is still strong for such a large topic, but usage slowed in 2018 (+13%) and cooled significantly in 2019, growing by just 7%. But sustained interest in cloud migrations—usage was up almost 10% in 2019, on top of 30% in 2018—gets at another important emerging trend. ML + AI are up, but passions have cooled. Security is surging.

Insiders

Sign Up for our Newsletter

This site is protected by reCAPTCHA and the Google Privacy Policy and Terms of Service apply.

article thumbnail

Defining data science in 2018

Data Science and Beyond

Two years later, I published a post on my then-favourite definition of data science , as the intersection between software engineering and statistics. This article is a short summary of my understanding of the definition of data science in 2018. Even better – I still get paid for being a data scientist. But what does it mean?

article thumbnail

2018 Data and Visualization Gift Ideas

Juice Analytics

Books we read in 2018. The Man Who Lied to His Laptop: What We Can Learn About Ourselves from Our Machines - A seminal read on learning about interactions between humans and machines. A book and apparel line in 2018. These are some of our favorite books and gift ideas for the data scientist, designer or analyst in your life.

article thumbnail

A history of tech adaptation for today’s changing business needs

CIO Business Intelligence

Following this, in 2002, it began delivering its knowledge to customers in online format, using dashboards and interactive reports that provided easier and faster access to data and analysis. Additionally, it continuously explores reams of data and modern tools to improve its capabilities and adapt to the changing data landscape.

article thumbnail

Top Data Science Tools That Will Empower Your Data Exploration Processes

datapine

To fully leverage the power of data science, scientists often need to obtain skills in databases, statistical programming tools, and data visualizations. It helps to automate and makes the usage of the R programming statistical language easier and much more effective. perfect for statistical computing and design.

article thumbnail

How to use Netezza Performance Server query data in Amazon Simple Storage Service (S3)

IBM Big Data Hub

To make it easy for clients to understand how to utilize this capability within NPS, a demonstration was created that uses flight delay data for all commercial flights from United States airports that was collected by the United States Department of Transportation (Bureau of Transportation Statistics). Prerequisites for the demo.