Remove 2018 Remove Interactive Remove Visualization
article thumbnail

5 key areas for tech leaders to watch in 2020

O'Reilly on Data

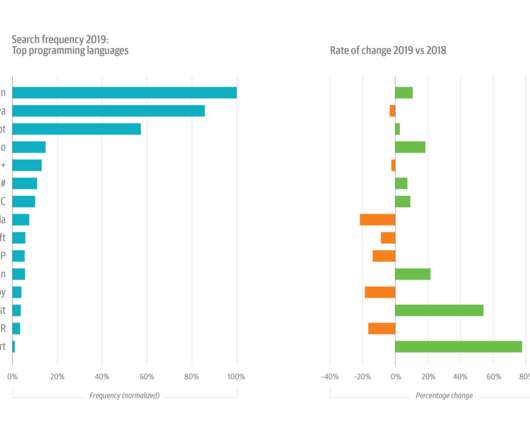
Growth is still strong for such a large topic, but usage slowed in 2018 (+13%) and cooled significantly in 2019, growing by just 7%. But sustained interest in cloud migrations—usage was up almost 10% in 2019, on top of 30% in 2018—gets at another important emerging trend. ML + AI are up, but passions have cooled. Security is surging.

article thumbnail

Consolidation around Cognos 11.1 and other news from IBM Analytics University

David Menninger's Analyst Perspectives

helping provide some clarity to their analytics offerings, along with new visualizations and better data preparation. This also includes a new conversational assistant to help generate narrative explanations of displays and interactive queries.

Analytics 167
Insiders

Sign Up for our Newsletter

This site is protected by reCAPTCHA and the Google Privacy Policy and Terms of Service apply.

article thumbnail

VR Data Visualization: More Natural Interactions with Data

The Data Visualisation Catalogue

While researching on the Buzz Surrounding VR Data Visualization , I found the most common claim being made was that VR allows for more “Natural” interactions with the data. For long, we have relied on mice and keyboards to facilitate this sense of interactivity. How will virtual reality transform big data visualization?

article thumbnail

Create Modern SQL Dashboards With Professional Tools & Software

datapine

In some cases, you will need a coding solution where you can build your own queries, but in others, you will also look for a visual representation of your realational data. How To Create SQL Dashboards – Coding & Visuals. The good news is that you can utilize both with the help of a modern and professional SQL dashboard.

article thumbnail

Top 10 IT & Technology Buzzwords You Won’t Be Able To Avoid In 2020

datapine

Exciting and futuristic, the concept of computer vision is based on computing devices or programs gaining the ability to extract detailed information from visual images. Visual analytics: Around three million images are uploaded to social media every single day. Artificial Intelligence (AI).

article thumbnail

Interview with: Sankar Narayanan, Chief Practice Officer at Fractal Analytics

Corinium

Newer methods can work with large amounts of data and are able to unearth latent interactions. One approach is to use NLP techniques to analyze actual call center interactions with customers. What advances do you see in Visual Analytics in the next five years? There are three strong trends in Visual Analytics.

Insurance 250
article thumbnail

A Complete Guide To Bar Charts With Examples, Benefits, And Different Types 

datapine

2) Pros & Cons Of Bar Charts 3) When To Use A Bar Graph 4) Types Of Bar Charts 5) Bar Graphs & Charts Best Practices 6) Bar Chart Examples In today’s fast-paced analytical landscape, data visualization has become one of the most powerful tools organizations can benefit from to be successful with their analytical efforts.