This site uses cookies to improve your experience. To help us insure we adhere to various privacy regulations, please select your country/region of residence. If you do not select a country, we will assume you are from the United States. Select your Cookie Settings or view our Privacy Policy and Terms of Use.
Cookie Settings
Cookies and similar technologies are used on this website for proper function of the website, for tracking performance analytics and for marketing purposes. We and some of our third-party providers may use cookie data for various purposes. Please review the cookie settings below and choose your preference.
Used for the proper function of the website
Used for monitoring website traffic and interactions
Cookie Settings
Cookies and similar technologies are used on this website for proper function of the website, for tracking performance analytics and for marketing purposes. We and some of our third-party providers may use cookie data for various purposes. Please review the cookie settings below and choose your preference.
Strictly Necessary: Used for the proper function of the website
Performance/Analytics: Used for monitoring website traffic and interactions
BPM as a driver of IT success Making a significant contribution to Norma’s digital transformation, a BPM team was initiated in 2020 and its managers support all business areas to improve and harmonize the understanding of applications and processes, as well as data quality.
According to Fortune Business Insights approximately 67% of the global workforce has access to business intelligence (BI) tools, and 75% has access to data analytics software. Ultimately, they trust gut feel over Power BI dashboards. Modern BI dashboards wont be about correlated data sets.
With widely used versions like Crystal Reports 2016 and its server editions anticipating losing support on December 31, 2027, and Crystal Reports 2020 scheduled to end support by 2026, you’re left with limited time to determine how to move forward without disruptions to your business intelligence workflows. So, what are your options?
According to Gartner , the mandatory features of a BI platform include: Data visualization: Platforms must support the graphical representation of information and data, and the creation of interactive dashboards. With that, business analysts can build and refine dashboards using natural language.
Spreadsheets finally took a backseat to actionable and insightful data visualizations and interactive business dashboards. The trends we presented last year will continue to play out through 2020. In 2020, BI tools and strategies will become increasingly customized. Suddenly advanced analytics wasn’t just for the analysts.
According to the EMC Digital Universe study, by 2020, around 40 trillion megabytes – or 40 zettabytes – will exist in our digital landscape. Enter data dashboards – one of history’s best innovations in business intelligence. Let’s kick things off by asking the question: what is a data dashboard? What Is A Data Dashboard?
“Software as a service” (SaaS) is becoming an increasingly viable choice for organizations looking for the accessibility and versatility of software solutions and online data analysis tools without the need to rely on installing and running applications on their own computer systems and data centers.
In this post, we’re going to give you the 10 IT & technology buzzwords you won’t be able to avoid in 2020 so that you can stay poised to take advantage of market opportunities and new conversations alike. Get the inside scoop and learn all the new buzzwords in tech for 2020! Computer Vision.
That’s why we have prepared a list of the most prominent business intelligence buzzwords that will dominate in 2020. Exclusive Bonus Content: Get Our 2020 BI Buzzwords Handbook! We mentioned predictive analytics in our business intelligence trends article and we will stress it here as well since we find it extremely important for 2020.
Software as a service (SaaS) has blossomed in the last five years, and the public SaaS market is expected to grow to $76 billion by the year 2020, according to FinancesOnline. That’s where SaaS dashboards enter the fold. Exclusive Bonus Content: Your Definitive Guide to SaaS & Dashboards! What Is A SaaS Dashboard?
Dengan meningkatnya peran software business intelligence (BI) di perusahaan-perusahaan, efek dan penggunaan teknologi ini akan meningkat pesat di tahun mendatang. Software BI membantu bisnis dengan tampilan dan analitik data untuk membantu perusahaan dalam melihat situasi, tantangan pasar dan juga peluang. Dari Google. Dari Google.
They currently spend just under $4 billion in 2020. New software uses AI to manage bank loans. AI Makes Bank Lending Software Far More Reliable. In this article, we decided to cover the tendencies in banking loan software in 2022 and give a brief market outlook of AI-driven lending software as a whole.
Apa software terbaik untuk memvisualisasi data? Pertanyaan ini cukup rumit karena terdapat banyak macam software untuk memvisualisasi data. Software-software ini dapat memenuhi kebutuhan dan permintaan yang berbeda-beda sesuai dengan keahlian si pengguna. Pemula tidak perlu menguasai semua software ini. Code Tools.
Data visualization software is an application that helps you to transforms raw data in easy to understand graphical formats. Various data visualization software on the market specializes in different data visualization types. To help you faster find the data visualization software, I categorized these tools into different types.
However, none of these features would be viable without web dashboards. We talked about the benefits of business dashboards before , but web dashboards have their own benefits. Big data and web dashboards go hand in hand. Big Data is Critical to Developing Web Dashboards. What is a web dashboard?
Another distinct trait of this software is its feature of data entry. The other prominent features of this software include, Open APIs for customization. It offers a complete framework for producing reports and dashboards from any database without coding. TeamSpaces is another distinct feature of this software, .
Deal furthers mission to deliver powerful portfolio of enterprise software solutions for Office of the CFO; expands real-time financial reporting capabilities for top ERPs Sage and Viewpoint. The construction industry has been hit especially hard by the events of 2020, with spending in the US forecast to be down as much as 9 percent.
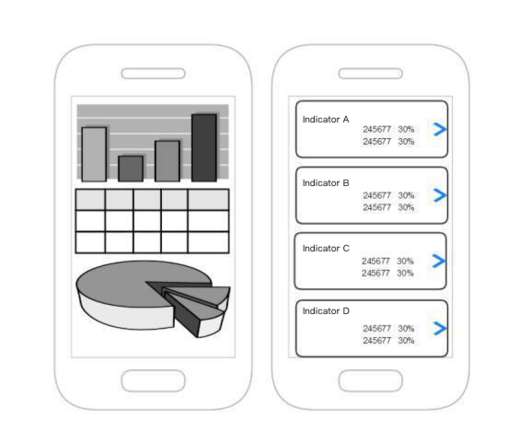
The mobile dashboard allows you to monitor the real-time business performance, check what is going on, query the business data anytime and anywhere. However, mobile dashboards are designed differently from regular dashboards because they need to fit on a small screen adaptively. The design of the mobile dashboard layout.
Today, I listed the 10 best reporting tools you can’t miss in 2020, which covers the open-source and commercial, different types of reporting tools. In this reporting tools list , I highlighted these software’s benefits, disadvantages, price, and suitable users. As reporting software, it does not support OLAP.
They prefer self-service development, interactive dashboards, and self-service data exploration. Analytics dashboards. Create highly interactive dashboards and content with visual exploration operations and embedded advanced geospatial analysis. Highway monitoring dashboard made with FineReport. Embed analysis content.
Jadi inilah alasan mengapa kita harusnya mulai memakai software BI pembuat laporan. Excel adalah software perkantoran pribadi yang unik tapi fungsinya tidak cukup untuk penggunaan komersil. Mengapa Anda Perlu Memilih Software BI Pembuat Laporan? Dashboard Komprehensif. Alasan utamanya adalah waktu pemrosesan.
Your Chance: Try a professional data visualization software for free! Data visualizations put together in intuitive dashboards can make the analysis process more dynamic and understandable while keeping the audience engaged. Your Chance: Try a professional data visualization software for free! e) Bar or column chart.
JFreeChart dapat membuat grafik garis, grafik batang, diagram pie, grafik, grafik area, grafik Gantt, dashboard, grafik gabungan dan grafik lainnya. Versi Community Edition-nya gratis, lisensi dari Apache Software License. Anda mungkin juga tertarik dengan… Laporan Perusahaan: Panduan Komprehensif 2020. Dari Google.
In this post, we will go over some finance manager KPIs, KRAs and KPIs for a finance department, and how financial reporting software is able to enhance this process. How to Build Finance Department KPI Dashboards. EBITDA and EBITDA growth are best tracked using financial reporting software as they are very data intensive.
Also, the features of an enterprise reporting tool can be associated with business intelligence (BI) software suite. Today, many enterprise reporting software has good support for the underlying data and can both make reports as a reporting tool and manage reports as a reporting portal. Best Reporting Tools List You Can’t Miss in 2020.
There are many ways to analyze data, but one of the most vital aspects of analytical success in a business context is integrating the right decision support software and technology. By 2020, around 7 megabytes of new information will be generated every second for every single person on the planet. Answer your questions.
ICEDQ — Software used to automate the testing of ETL/Data Warehouse and Data Migration. Naveego — A simple, cloud-based platform that allows you to deliver accurate dashboards by taking a bottom-up approach to data quality and exception management. Acquired by Informatica, July 2020) . Production Monitoring Only. Azure DevOps.
We will also discuss how engineering dashboards are imperative for tracking KPIs and can streamline a reporting process. How to Build Useful KPI Dashboards. However, when you eventually decide to add more engineering performance metrics to your engineering dashboard, there are several things that you should take into consideration.
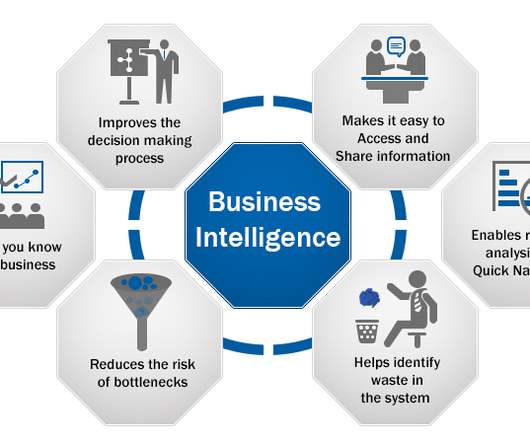
In response to this increasing need for data analytics, business intelligence software has flooded the market. Try our professional BI software for 14 days, completely free! We are going to be honest here, even the best software needs some initial heavy lifting to maximize its potential. Actually, it usually isn’t.
To help you get started with the topic, we put together this insightful guide on modern performance reporting using professional online dashboards. Try our professional reporting software for 14 days, completely free! In general, we can observe that the period of April 2020 performed worst than expected.
We’ve rounded up some of the top trends and predictions shaping financial transformation in 2020 and beyond. Cutting-edge financial software suites are using automation as much as possible to accelerate business processes, reduce errors, and free up human capital, which can then be put toward other important tasks.
In a similar vein, 44% of businesses declared that they intend to increase their spending on technology in 2020, in contrast to 38% last year. While the biggest slice of this increased budget is going to replace outdated tech hardware, servers, and other devices, aabout one-third is still being spent on software.
Building a data-driven business includes choosing the right software and implementing best practices around its use. Will every department need access to BI and dashboards? Executive dashboards : BI access is limited to the C-level, providing execs with a real-time, big-picture look at company performance.
In this article, you’ll discover: upcoming trends in business intelligence what benefits will BI provide for businesses in 2020 and on? Business intelligence software will be more geared towards working with Big Data. Future of BI: What Does it Hold? Below we break down the latest trends in business intelligence. Data Governance.
Dashboard Excel bisa menjadi sebuah alat yang canggih dalam melacak KPI, membandingkan indikator data, menyediakan analisa dan wawasan dalam membantu manajemen membuat keputusan. Apa itu Dashboard Excel dan Apa Perbedaan Dashboard Excel dan Laporan. Pertama-tama, kita perlu memahami ini: apa itu dashboard? Coba gratis.
Kalau bicara soal software penganalisa data, biasanya kita punya banyak pertanyaan. Apa perbedaan dari berbagai macam software penganalisa data? Saya akan secara objektif memberitahu Anda pandangan pribadi saya mengenai software-software penganalisa data di pasar untuk referensi Anda. Software BI. dan Tableau.
This post will go over both the following explicit and implicit financial KPIs that you should be aware of, how they are calculated, and how financial reporting software can help simplify this process for your finance department: Operating Cash Flow. How to Build Useful KPI Dashboards. This is often best handled by a KPI dashboard.
Plus, knowing the best way to learn SQL is beneficial even for those who don’t deal directly with a database: Business Intelligence software , such as datapine, offers intuitive drag-and-drop interfaces, allowing for superior data querying without any SQL knowledge. SQL can perform a multitude of complex functions in a fraction of a second.
This post will take you through the 30 top manufacturing KPIs and metrics to use in your 2020 reporting, how they are calculated, and how you can streamline your reporting process using manufacturing specific reporting software. How to Build Useful KPI Dashboards. Streamline Your Reporting with Manufacturing Reporting Software.
This fostered the emergence of an ecosystem of software providers, including Capital One Software, with products designed to optimize the efficient use of cloud analytic data platforms. Capital One Software was launched in 2022 to build a business around Capital One Slingshot.
Apakah Anda sudah memutuskan software mana dari daftar tersebut untuk dipakai? Apa perbedaan Excel, software BI, dan aplikasi laporan? Yang pertama adalah software yang pada umumnya membuat laporan yang tetap. Software ini dapat menangani kebutuhan sementara yang sederhana. Fungsi Software Aplikasi Laporan Untuk Bisnis.
Untuk semua masalah ini, kita dapat menggunakan beberapa software untuk menanganinya. Software Pengelola Data. Disaat seperti ini, kita dapat menggunakan sistem dashboard dan laporan yang didesain oleh FineReport untuk menangani masalah ini secara efektif. Software Pengelola Waktu. Software Komunikasi Tim.
Data visualization software is an application that helps you to transforms raw data in easy to understand graphical formats. Various data visualization software on the market specializes in different data visualization types. To help you faster find the data visualization software, I categorized these tools into different types.
We’ve collected the biggest posts of 2019 to give you a look at where the industry has been and where it’s going to give you the can’t-miss perspectives and how-to’s you need to start 2020 off strong. Analytics and data are becoming an integral part of every software product and every company. Activate Your Dashboard.
We organize all of the trending information in your field so you don't have to. Join 42,000+ users and stay up to date on the latest articles your peers are reading.
You know about us, now we want to get to know you!
Let's personalize your content
Let's get even more personalized
We recognize your account from another site in our network, please click 'Send Email' below to continue with verifying your account and setting a password.


Let's personalize your content