This site uses cookies to improve your experience. To help us insure we adhere to various privacy regulations, please select your country/region of residence. If you do not select a country, we will assume you are from the United States. Select your Cookie Settings or view our Privacy Policy and Terms of Use.
Cookie Settings
Cookies and similar technologies are used on this website for proper function of the website, for tracking performance analytics and for marketing purposes. We and some of our third-party providers may use cookie data for various purposes. Please review the cookie settings below and choose your preference.
Used for the proper function of the website
Used for monitoring website traffic and interactions
Cookie Settings
Cookies and similar technologies are used on this website for proper function of the website, for tracking performance analytics and for marketing purposes. We and some of our third-party providers may use cookie data for various purposes. Please review the cookie settings below and choose your preference.
Strictly Necessary: Used for the proper function of the website
Performance/Analytics: Used for monitoring website traffic and interactions
There are a number of reasons that data analytics is transforming the direction of GTM marketing in 2021. Benefits include: Using data analytics to better identify your target audience Developing a stronger competitive advantage Forecasting trends with predictive analytics to anticipate future market demand.
An Operations Key Performance Indicator (KPI) or metric is a discrete measurement that a company uses to monitor and evaluate the efficiency of its day-to-day operations. Leading companies make use of KPIs and KPI dashboards to measure their efficiency in real time. What is an Operations KPI?
Insights discovery from ubiquitous data collection (via the tens of billions of connected devices that will be measuring, monitoring, and tracking nearly everything internally in our business environment and contextually in the broader market and global community) is ultimately about value creation and business outcomes.
A real estate Key Performance Indicator (KPI) or metric is a quantifiable measure used to assess the performance of a business in the real estate industry. 2021 Industry Financial Outlook: Real Estate and Property Management. What is a Real Estate KPI? Real Estate Investor KPIs. Not so fast.
While in 2021, the global market for corporate predictive analytics was worth $10 billion, it is forecast to balloon to $28 billion by 2026. This unlocks the ability to apply knowledge consistently across all teams, to take better decisions and accurately measure outcomes.
Gartner’s new IT spending forecast predicts spending growth in all five major IT categories, including software, IT services, and communications services. increase in IT spending this year, and it measured a 3.3% Hyperscalers will buy about 70% of the AI servers purchased this year, Loveland predicted. growth in 2023. trillion and $1.49
According to a BloombergNEF report, climate-tech companies focused on climate-tech innovation raised $165 billion in 2021 across private and public markets [2]. For example, India is also using AI to enhance weather forecasting and climate modelling. Artificial Intelligence is one way forward to tackling the issues of climate change.
billion in 2021, which was also above analyst expectations of €6.9 Despite the impact on its Russian business, SAP confirmed its 2022 forecast for cloud revenue is expected to be between €11.5 The company’s cloud revenue climbed 31% to €2.8 billion (US$3.02 Total revenue for the quarter rose to €7.1 billion from €6.4 billion and €11.9
The AI Experience Worldwide (Virtual) Conference , scheduled for May 11-12, 2021 in the APAC, EMEA, and Americas regions, is right around the corner. The post Strong Speakers List Highlights DataRobot’s 2021 AI Experience Worldwide Conference appeared first on DataRobot. AI Experience Worldwide. The Hunt for Transformational Growth.
They include missing out on new revenue opportunities, poorly forecasting performance, and making bad investments. Organizations with a strong data culture use data to drive more new revenue opportunities, more accurate forecasting, and smarter investments. Measure and continually refine processes. Have a strong data culture?
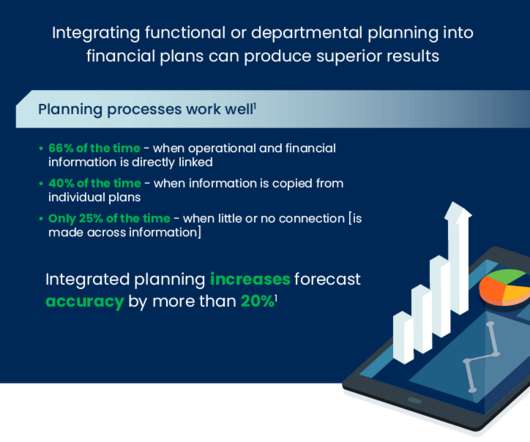
Financial planners suddenly found it imperative to strengthen the lines of communication with operations personnel to figure out jointly what operational steps should be taken, as well as how those measures would impact the organization’s working capital. Planners began to integrate functional and departmental plans into their own forecasts.
billion by the end of 2021. S/He is responsible for providing cost-effective solutions to achieve business objectives, comparing operational progress against project development while assisting in planning budgets, forecasts, timelines, and developing reports on performance metrics. million in the USA alone.
In August 2021, the OECD announced that 134 countries and jurisdictions had joined a new two-pillar plan to reform international taxation rules. This, in turn, has led some governments to adopt unilateral measures as a single, centralized agreement is finalized. The Current Picture. The Complete Guide to Corporate Tax Software.
Historically, financial planning & analysis has centered around tasks such as planning, budgeting, forecasting, and performance management. When a measurable change occurs, Finance requires the ability to respond immediately. This practice will exceed 45% of all enterprise IT spending, up from less than 17% in 2021.
These proactive measures are made possible by evolving technologies designed to help people adapt to the effects of climate change today. 5 The Global Disaster Preparedness Center recommends policymakers and others adopt a range of measures to help their regions adapt to higher heat. Nature Geoscience , 14 , 473–478 (2021).
AIOps yields measurable results In my experience working with IT decision-makers, many say they expect AIOps to increase IT/DevOps efficiency by reducing cycle times, improving resource utilization, and ultimately helping them increase market penetration and make more money. 2 Dell Technologies survey of CloudIQ users, 2021.
Regular review of flash reports provides a rough measure of change in the organization and gives insight into real-time trends and customer behavior. The flash PMI is a commonly referenced monthly flash report that managers and financial analysts use to measure the health of manufacturing and understand the current economic trends.
Business leaders, likewise, recognize that when an organization has a few clearly defined, measurable objectives–and when it consistently monitors performance against those objectives–it enables the business to stay on track to achieve its primary goals. BI Dashboards in 2021 and Beyond. Why Use a BI Dashboard?
The businesses with the resilience to roll with the punches have fared measurably better than those lacking a fast-acting ability to protect operations, technology, and employees from crisis and chaos. Since Fall 2021, students and faculty have been required to physically return to the classroom.
You wanted something, or needed a part to produce a product, and you simply ordered it and it would be delivered — quickly, affordably, and with forecastable precision. When the same survey was repeated in March-April 2021, only 23% still said they were planning on nearshoring.”. This is no longer the case.
In 2021, the New York Times tackled the issue , reporting that “The 37-Year-Olds Are Afraid of the 23-Year-Olds Who Work for Them.”. I forecast four new realities facing IT leaders in the years ahead: You will get strategic about skill building. You will measure and respond to employee satisfaction.
In 2021, the New York Times tackled the issue , reporting that “The 37-Year-Olds Are Afraid of the 23-Year-Olds Who Work for Them.”. I forecast four new realities facing IT leaders in the years ahead: You will get strategic about skill building. You will measure and respond to employee satisfaction.
Additionally, evaluate how easy it is to use and how it integrates with other systems and security measures. It tracks inventory levels, manages stock replenishment, handles purchase orders, and generates sales forecasts. They’ll help you to understand sales trends, forecast future stock needs, and optimize the supply chain.
Business intelligence strategy is seen as a roadmap designed to help companies measure their performance and strengthen their performance through architecture and solutions. KPI (Key Performance Indicator)-the indicator you will use to measure performance. The accuracy of the store customer flow forecast has now reached 95%.
Call for Code drives innovation and growth The first Challenge round concluded in April, and the university challenge winner was submitted by Team BlueReef Foundation, who designed a new way to measure coral reef health using IBM Watson Studio, IBM Cloud Object Storage and IBM API Connect.
And it has quite some catching up to do – the smart manufacturing industry is set to grow from $250 billion in 2021 to $658 billion in 2029. These instruments measure a variety of environmental factors such as temperature, tilt angle, shock, humidity and so on to ensure quality of goods in transit.
Fortune Business Insights predicts that the global BI market will grow to $43 billion by 2028 , up from $24 billion in 2021. They can then use this data to measure the company’s sales performance and predict future outcomes. BI simplifies traditionally complex forecasting in the form of SaaS tools and levels the playing field for SMBs.
Then to perform more complex data analysis such as regression tests and time series forecasting, you can use Apache Spark with Python, which allows you to take advantage of a rich ecosystem of libraries, including data visualization in Matplot, Seaborn, and Plotly. First, we create a database in the Data Catalog using Athena and Spark.
In fact, you may have even heard about IDC’s new Global DataSphere Forecast, 2021-2025 , which projects that global data production and replication will expand at a compound annual growth rate of 23% during the projection period, reaching 181 zettabytes in 2025. The majority of them are mobile and utilize social media.
The transaction is expected to close in December 2021, subject to receipt of regulatory approvals and the satisfaction of other customary closing conditions. CDW will hold a conference call today, October 18, 2021 at 7:00 am CT to discuss the transaction. Timing, Approvals and Financing. CDW has committed financing for the transaction.
This post aims to delve into the dichotomous nature of generative AI, shedding light on its potential to bolster our security measures and serve as a tool for unprecedented cyberattacks. Research from MarketsandMarkets forecasts that the AI market will grow from USD 58.3 billion in 2021 to USD 309.6 during the forecast period.
It was titled, The Gartner 2021 Leadership Vision for Data & Analytics Leaders. It is meant to be a desk-reference for that role for 2021. The fill report is here: Leadership Vision for 2021: Data and Analytics. Do you see these as one role or two in 2021? Where do you see the data ethics in 2021 challenges?
Seagate Technology forecasts that enterprise data will double from approximately 1 to 2 Petabytes (one Petabyte is 10^15 bytes) between 2020 and 2022. Cisco estimates that global IP data traffic has grown 3-fold between 2016 and 2021, reaching 3.3 Most of that data will be unstructured, and only about 10% will be stored.
It refers to a set of metrics used to measure an organization’s environmental and social impact and has become increasingly important as it relates to a company’s business model, risk management strategy , reporting requirements and more. link resides outside ibm.com), Green Central Banking, Costa, 13 September, 2023 5.
This tells Q what to count when your business users ask questions like “How many were enrolled in biology in 2021?” Set default aggregations Q will always aggregate measure values a business user asks for, so it’s important to use measures that retain their meaning when brought together with other values.
If Basel IV defines how to measure credit and operational risk for the purposes of capital reserve requirements, FRTB defines how to measure market risk for the same purpose. Forecasting simulated profits and losses using their model’s calculated capital reserves . of the standardized result.
In 2021, Winter Storm Uri wreaked havoc on Texas, leaving over 4.5 Ineffective outage predictions: Many utilities struggle to accurately predict outages, and load and energy demand due to a lack of weather forecast parameters, inconsistent data and inadequate technology.
Enter the age of data-driven protocol assessment: using benchmarking tools and predictive modeling to gauge protocol intricacies and forecast eligible patient numbers, which then inform protocol adjustments. Ensuring early assumptions resonate with real-world execution is paramount.
Through the process, businesses will measure their performance, seek out incomparable competitive advantages and dig out needs of customers. FineReport is honorable mentioned in Gartner 2021 Magic Quadrant for Analytics and Business Intelligence Platforms. The accuracy of store customer flow forecast has now reached 95%.
Through the process, businesses will measure their performance, seek out incomparable competitive advantages and dig out needs of customers. FineReport is honorable mentioned in Gartner 2021 Magic Quadrant for Analytics and Business Intelligence Platforms. The accuracy of store customer flow forecast has now reached 95%.
Finance and banking regulatory costs have been forecasted to rise from 4 percent to 10 percent of revenue by 2021. Stop-Gap Measures Are Not Enough. The volume of regulations and the scale of ongoing regulatory compliance legislation often leave finance teams struggling to meet new reporting requirements.
Would you put your client’s sales forecast into Facebook? All you have are statistical methods to observe the output and measure it, and it’s not possible to test the whole area of capability of AI.” Probably not,” Orlandini says. Layers of control There’s no guarantee a gen AI model won’t produce biased or dangerous results.
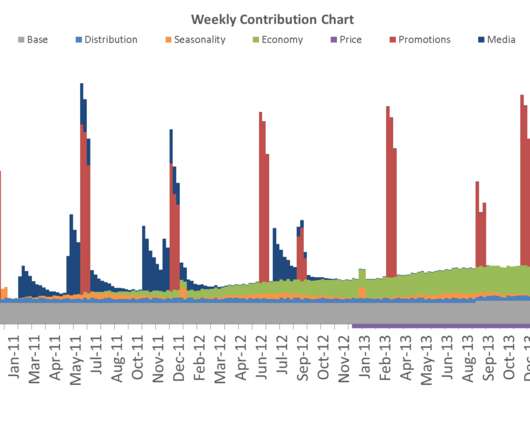
MMM stands for Marketing Mix Model and it is one of the oldest and most well-established techniques to measure the sales impact of marketing activity statistically. It is pretty obvious to a data scientist that the only way one can measure the effect of an event is by knowing which events are happening at what time. What is MMM?
However, in 2020 and 2021, the login frequency of users spiked across age groups around March of 2020 as people stayed home during the pandemic, but still needed to manage their finances. Forecasting consumer trends. Mitigating risk, detecting suspicious activity, and preventing fraud.
We organize all of the trending information in your field so you don't have to. Join 42,000+ users and stay up to date on the latest articles your peers are reading.
You know about us, now we want to get to know you!
Let's personalize your content
Let's get even more personalized
We recognize your account from another site in our network, please click 'Send Email' below to continue with verifying your account and setting a password.


Let's personalize your content