This site uses cookies to improve your experience. To help us insure we adhere to various privacy regulations, please select your country/region of residence. If you do not select a country, we will assume you are from the United States. Select your Cookie Settings or view our Privacy Policy and Terms of Use.
Cookie Settings
Cookies and similar technologies are used on this website for proper function of the website, for tracking performance analytics and for marketing purposes. We and some of our third-party providers may use cookie data for various purposes. Please review the cookie settings below and choose your preference.
Used for the proper function of the website
Used for monitoring website traffic and interactions
Cookie Settings
Cookies and similar technologies are used on this website for proper function of the website, for tracking performance analytics and for marketing purposes. We and some of our third-party providers may use cookie data for various purposes. Please review the cookie settings below and choose your preference.
Strictly Necessary: Used for the proper function of the website
Performance/Analytics: Used for monitoring website traffic and interactions
Spreadsheets finally took a backseat to actionable and insightful data visualizations and interactive business dashboards. Hotels try to predict the number of guests they can expect on any given night in order to adjust prices to maximize occupancy and increase revenue. Data exploded and became big. We all gained access to the cloud.
Knowledgebase Articles Datasets & Cubes : Blend Append : Merge monthly plan data with actual daily sales data and create plan vs actual data Access Rights, Roles & Permissions : Password patterns and configurations in Smarten Dashboards : Dashboard Creation Best Practices Predictive Use cases Assisted predictivemodelling : Classification : (..)
Knowledgebase Articles Datasets & Cubes : Handling multiple JOINs through Step by Step Procedure to create a dataset General : Global Variable : Making use of Global variables Access Rights, Roles and Permissions : Password patterns and configurations in Smarten Predictive Use cases Assisted predictivemodelling : Regression : Medical Cost Prediction (..)
In 2024, data visualization companies play a pivotal role in transforming complex data into captivating narratives. Let’s embark on a journey to uncover the top 10 Data Visualization Companies of 2024. Innovations such as AI-driven analytics, interactive dashboards , and predictivemodeling set these companies apart.
Evolving BI Tools in 2024 Significance of Business Intelligence In 2024, the role of business intelligence software tools is more crucial than ever, with businesses increasingly relying on data analysis for informed decision-making. When comparing leading BI tools, it is crucial to assess these aspects thoroughly.
Moreover, as most predictive analytics capabilities available today are in their infancy — they have simply not been used for long enough by enough companies on enough sources of data – so the material to build predictivemodels on was quite scarce. BN by the end of 2024, according to MarketWatch.
In 2024, business intelligence (BI) software has undergone significant advancements, revolutionizing data management and decision-making processes. Additionally, they visually represent extensive datasets to reveal trends and patterns, ultimately delivering insights through reports or dashboards to key stakeholders.
Through interactive dashboards and visual representations, analysts can explore various dimensions of the dataset, drilling down into specific subsets or categories for detailed analysis. Well-designed charts, infographics, and interactive dashboards create an immersive experience that draws viewers into the world of data analysis.
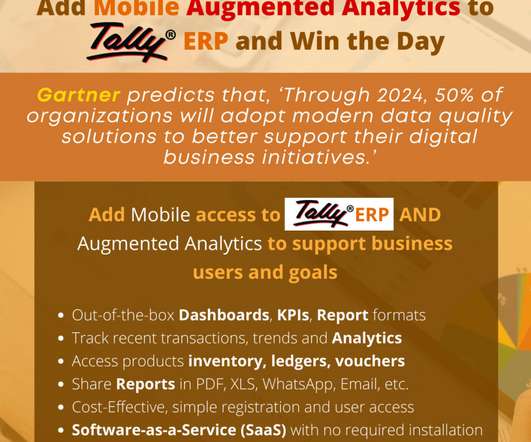
Tech research and analysis firm, Gartner predicts that, ‘Through 2024, 50% of organizations will adopt modern data quality solutions to better support their digital business initiatives,’ and that prediction applies to all types of industries and vertical business sectors, including finance and accounting.
Similarly, Deloittes 2024 CxO Survey highlights that while CDOs prioritize AI and business efficiency, sustainability remains a secondary focus. Predictivemodeling can help companies optimize energy consumption, while AI-driven insights can identify supply chain inefficiencies that lead to excessive waste.
The world-renowned technology research firm, Gartner, predicts that, ‘through 2024, 50% of organizations will adopt modern data quality solutions to better support their digital business initiatives’. Combine Traditional BI with Modern BI and Analytics to Improve User Adoption and Gain Advantage !
When combined, SaaS BI tools enable users to conduct comprehensive data analysis using modern cloud BI technology , providing access to all data sources and the ability to compile online dashboards from mobile devices. Tableau , developed by Salesforce, is another prominent player in the realm of SaaS BI software.
1 globally by 2024, companies should consider that more marketing does not necessarily lead to more customers acquisition. For example, you could set up a data pipeline that delivers DataRobot predictions to HubSpot to automatically initiate offers within the business rules you set. Training and Testing Different AI Models.
The integration of clinical data analysis tools empowers healthcare providers to leverage predictive analytics for proactive decision-making. Through the utilization of predictivemodels, clinicians can forecast patient outcomes and resource needs, enabling early intervention and personalized care delivery.
2024 has been an exciting year in the world of embedded analytics and business intelligence. At insightsoftware, we deliver advanced analytics with Logi Symphony , which offers powerful self-service and managed dashboards, AI-driven assistance, and broader accessibility to users at every level.
A Guide to the Six Types of Data Quality Dashboards Poor-quality data can derail operations, misguide strategies, and erode the trust of both customers and stakeholders. Data quality dashboards have emerged as indispensable tools, offering a clear window into the health of their data and enabling targeted actionable improvements.
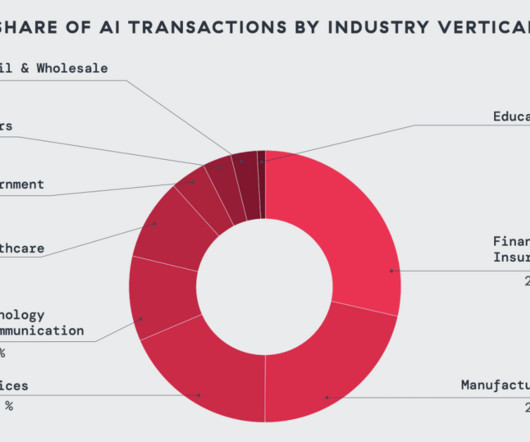
5 key findings: AI usage and threat trends The ThreatLabz research team analyzed activity from over 800 known AI/ML applications between February and December 2024. AI-powered breach prediction: Preempt potential breach scenarios using generative AI and multi-dimensional predictivemodels.
We organize all of the trending information in your field so you don't have to. Join 42,000+ users and stay up to date on the latest articles your peers are reading.
You know about us, now we want to get to know you!
Let's personalize your content
Let's get even more personalized
We recognize your account from another site in our network, please click 'Send Email' below to continue with verifying your account and setting a password.


Let's personalize your content