Trending Articles

article thumbnail

Finetuning Phi-Medium to Generate Cypher Query from Text

Analytics Vidhya

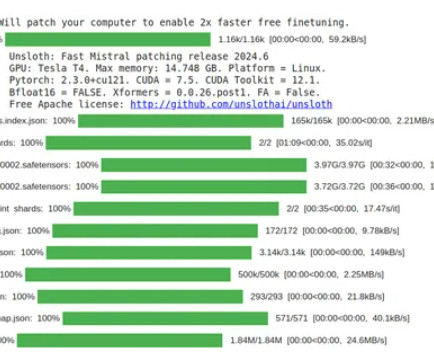
Introduction The rise of Retrieval-Augmented Generation (RAG) and Knowledge Graphs has revolutionized how we interact with complex data sets by providing a structured, interconnected representation of information. Knowledge Graphs, such as those used in Neo4j, facilitate the querying and visualization of relationships within data. However, translating natural language into structured query languages like Cypher remains […] The post Finetuning Phi-Medium to Generate Cypher Query from Text a

article thumbnail

Will VMWare’s licensing changes push devirtualization of data centers?

CIO Business Intelligence

The landscape of data center infrastructure is shifting dramatically, influenced by recent licensing changes from Broadcom that are driving up costs and prompting enterprises to reevaluate their virtualization strategies. A new trend — devirtualization, a process of migrating workloads from virtual to physical environments — is taking shape as a response to these changes, according to Gartner’s 2024 Hype Cycle for Data Center Infrastructure Technologies report.

Insiders

Sign Up for our Newsletter

This site is protected by reCAPTCHA and the Google Privacy Policy and Terms of Service apply.

Trending Sources

article thumbnail

How to Build a Multilingual Chatbot using Large Language Models?

Analytics Vidhya

Introduction This article covers the creation of a multilingual chatbot for multilingual areas like India, utilizing large language models. The system improves consumer reach and personalization by using LLMs to translate questions between local languages and English. We go over the architecture, implementation specifics, advantages, and required actions.

Modeling 342
article thumbnail

4 essential lessons in AI governance

CIO Business Intelligence

Austin-based software company Planview began using gen AI to boost productivity around 18 months ago. During that same period, they started integrating gen AI into their products, building a copilot that users interact with to do strategic portfolio management and value stream management. The copilot creates plan scenarios to help managers hit product release goals, and suggests ways to move deliverables around on roadmaps, share work between teams, and reallocate investment.

Risk 128
article thumbnail

Provide Real Value in your Applications with Data and Analytics

The complexity of financial data, the need for real-time insight, and the demand for user-friendly visualizations can seem daunting when it comes to analytics - but there is an easier way. With Logi Symphony, we aim to turn these challenges into opportunities. Our platform empowers you to seamlessly integrate advanced data analytics, generative AI, data visualization, and pixel-perfect reporting into your applications, transforming raw data into actionable insights.

article thumbnail

5 Free Online Courses to Learn Data Science Fundamentals

KDnuggets

Learn SQL, Python, statistics, mathematics, and data analysis—everything you need to learn before you start the journey of becoming a professional data scientist.

article thumbnail

Bring Data To The Other 80% Of Business Intelligence Users

Boris Evelson

Many of us remember the old days of enterprise business intelligence (BI) delivery where all requests for new or changed queries, reports, and dashboards had to go through a centralized IT team of BI and data professionals.

More Trending

article thumbnail

Exploring Microsoft’s AutoGen Framework for Agentic Workflow

Analytics Vidhya

Introduction In the rapidly evolving field of Generative AI, powerful models only do through prompting by humans until agents come, it’s like models are brains and agents are limbs, so, agentic workflow is introduced to do tasks autonomously using agents leveraging GenAI model. In the world of AI development agents are the future because agents […] The post Exploring Microsoft’s AutoGen Framework for Agentic Workflow appeared first on Analytics Vidhya.

Modeling 300
article thumbnail

Certifications That Can Boost Your Data Science Career in 2024

KDnuggets

In today's data science landscape, how does one set themselves apart from the competition? Let’s take a look at seven of the best certifications out there.

article thumbnail

Chart Snapshot: Correlation Matrices

The Data Visualisation Catalogue

Also known as a Matrix Chart, Matrix Diagram. A Correlation Matrix is a tabular form of data visualisation used for cross-examining multivariate data. This is done by placing variables in the rows and columns and varying-sized circle markers in the intersections. Correlation Matrices are good for showing variance, occurrences, revealing any patterns, displaying any similarities, and detecting any correlations between the variables.

article thumbnail

Introducing self-managed data sources for Amazon OpenSearch Ingestion

AWS Big Data

Enterprise customers increasingly adopt Amazon OpenSearch Ingestion (OSI) to bring data into Amazon OpenSearch Service for various use cases. These include petabyte-scale log analytics, real-time streaming, security analytics, and searching semi-structured key-value or document data. OSI makes it simple, with straightforward integrations , to ingest data from many AWS services, including Amazon DynamoDB , Amazon Simple Storage Service (Amazon S3), Amazon Managed Streaming for Apache Kafka (Amazo

article thumbnail

Entity Resolution: Your Guide to Deciding Whether to Build It or Buy It

Adding high-quality entity resolution capabilities to enterprise applications, services, data fabrics or data pipelines can be daunting and expensive. Organizations often invest millions of dollars and years of effort to achieve subpar results. This guide will walk you through the requirements and challenges of implementing entity resolution. By the end, you'll understand what to look for, the most common mistakes and pitfalls to avoid, and your options.

article thumbnail

AI incident reporting shortcomings leave regulatory safety hole

CIO Business Intelligence

Shortcomings in incident reporting are leaving a dangerous gap in the regulation of AI technologies. In other safety-critical industries, such as aviation and medicine, incidents are tracked and investigated but such incident reporting is lacking in the increasingly important are of AI, warns the Centre for Long-Term Resilience (CLTR) , a UK think tank.

Reporting 127
article thumbnail

How to Manage Files and Directories in Bash

KDnuggets

Bash, the Bourne-Again Shell, is commonly used in Unix-based systems like Linux and macOS and provides myriad tools for managing files and directories.

article thumbnail

Leveraging Big Data and AI: How Forex Trading Robots Are Transforming Financial Markets

Smart Data Collective

Big Data & AI in Forex: Discover how trading robots are revolutionizing financial markets and unlocking new strategies for success.

article thumbnail

Automate data loading from your database into Amazon Redshift using AWS Database Migration Service (DMS), AWS Step Functions, and the Redshift Data API

AWS Big Data

Amazon Redshift is a fast, scalable, secure, and fully managed cloud data warehouse that makes it simple and cost-effective to analyze all your data using standard SQL and your existing ETL (extract, transform, and load), business intelligence (BI), and reporting tools. Tens of thousands of customers use Amazon Redshift to process exabytes of data per day and power analytics workloads such as BI, predictive analytics, and real-time streaming analytics.

article thumbnail

Generative AI Deep Dive: Advancing from Proof of Concept to Production

Speaker: Maher Hanafi, VP of Engineering at Betterworks & Tony Karrer, CTO at Aggregage

Executive leaders and board members are pushing their teams to adopt Generative AI to gain a competitive edge, save money, and otherwise take advantage of the promise of this new era of artificial intelligence. There's no question that it is challenging to figure out where to focus and how to advance when it’s a new field that is evolving everyday. 💡 This new webinar featuring Maher Hanafi, VP of Engineering at Betterworks, will explore a practical framework to transform Generative AI pr

article thumbnail

What is Nominal Data?

Analytics Vidhya

Introduction Nominal data is one of the most fundamental types of data in data analysis. Identifying and interpreting it is essential in many fields, including statistics, computer science, psychology, and marketing. This article examines nominal data’s characteristics, applications, and differences from other data types. Overview What is Nominal Data?

article thumbnail

How smaller businesses can reimagine brand building with generative AI

CIO Business Intelligence

Generating and maintaining awareness is notoriously challenging for small businesses, often working with limited in-house resources and without the budget for external marketing support. In fact, recent research found that 67% of small business founders considered marketing and sales support one of their biggest challenges, with marketing budgets one of the first to see cuts in difficult conditions. 1 But generative AI (genAI) could answer this challenge, unleashing a new wave of creativity for

Sales 126
article thumbnail

Duck, Duck, Code: An Introduction to Python’s Duck Typing

KDnuggets

Explore the simplicity and flexibility of duck typing in Python — where code adapts based on behavior, not rigid types!

99
article thumbnail

Chart Snapshot: Contour Plots

The Data Visualisation Catalogue

A Contour Plot is a visualisation method used to represent a 3D plotted surface onto a 2D graph. It displays the relationship and changes between two independent variables (X and Y) and a dependent variable (Z). On a Contour Plot, the X and Y variables are plotted on the horizontal and vertical axes, while the Z variable is represented by contour lines or coloured bands.

article thumbnail

Leading the Development of Profitable and Sustainable Products

Speaker: Jason Tanner

While growth of software-enabled solutions generates momentum, growth alone is not enough to ensure sustainability. The probability of success dramatically improves with early planning for profitability. A sustainable business model contains a system of interrelated choices made not once but over time. Join this webinar for an iterative approach to ensuring solution, economic and relationship sustainability.

article thumbnail

Amazon DataZone enhances data discovery with advanced search filtering

AWS Big Data

Amazon DataZone , a fully managed data management service, helps organizations catalog, discover, analyze, share, and govern data between data producers and consumers. We are excited to announce the introduction of advanced search filtering capabilities in the Amazon DataZone business data catalog. With the improved rendering of glossary terms, you can now navigate large sets of terms with ease in an expandable and collapsible hierarchy, reducing the time and effort required to locate specific d

Sales 77
article thumbnail

Simpson’s Paradox: When Data Tells Two Different Stories!

Analytics Vidhya

Introduction Have you ever been fooled by statistics? Simpson’s paradox shows how analyzing data in total can obscure important trends. We can uncover hidden factors that reverse or eliminate relationships by breaking down information. This short guide will equip you to avoid being misled by aggregated data and ensure you see the whole picture.

article thumbnail

Provider or partner? IT leaders rethink vendor relationships for value

CIO Business Intelligence

Shane McDaniel was nearly a year into a modernization effort when he and his IT team for the City of Seguin, Texas, cut over from the city’s legacy network to the upgraded version. On hand for much of the work that Saturday in June 2019 was the rep from Extreme Networks, a Morrisville, N.C.-headquartered company that McDaniel had selected as the provider on the project.

IT 125
article thumbnail

How to Speed Up Python Pandas by Over 300x

KDnuggets

In this blog, we will define Pandas and provide an example of how you can vectorize your Python code to optimize dataset analysis using Pandas to speed up your code over 300x times faster.

article thumbnail

Deliver Mission Critical Insights in Real Time with Data & Analytics

In the fast-moving manufacturing sector, delivering mission-critical data insights to empower your end users or customers can be a challenge. Traditional BI tools can be cumbersome and difficult to integrate - but it doesn't have to be this way. Logi Symphony offers a powerful and user-friendly solution, allowing you to seamlessly embed self-service analytics, generative AI, data visualization, and pixel-perfect reporting directly into your applications.

article thumbnail

Chart Snapshot: Cleveland Dot Plots

The Data Visualisation Catalogue

Also known as a Dot Plot , Dot Graph , Dot Chart. A Cleveland Dot Plot is a simple form of data visualisation that plots dots to compare the values of a one-dimensional variable across multiple categories. On a Cleveland Dot Plot, one axis will list the categories, while the other axis represents a discrete value scale. A Cleveland Dot Plot serves as an alternative to a Bar Chart and offers a some advantages such as: reduced visual clutter, no need to start from zero, easier value comparison and

article thumbnail

Amazon MWAA best practices for managing Python dependencies

AWS Big Data

Customers with data engineers and data scientists are using Amazon Managed Workflows for Apache Airflow (Amazon MWAA) as a central orchestration platform for running data pipelines and machine learning (ML) workloads. To support these pipelines, they often require additional Python packages, such as Apache Airflow Providers. For example, a pipeline may require the Snowflake provider package for interacting with a Snowflake warehouse, or the Kubernetes provider package for provisioning Kubernetes

article thumbnail

Functional Dependency in DBMS

Analytics Vidhya

Introduction It is important for anybody working in the field of data science to know how databases work. My name is Sabreena. Functional dependency is one of the most basic concepts to understand when it comes to database management. It helps in the design, normalization, and optimization of relational databases, which makes it pivotal for […] The post Functional Dependency in DBMS appeared first on Analytics Vidhya.

article thumbnail

Morgan Stanley’s gen AI launch is about global analysis

CIO Business Intelligence

When Morgan Stanley announced its new generative AI support tools for financial advisors last week, it talked about gaining efficiencies from its notetaking abilities. But those who track the $54 billion financial firm said that its goal is much larger. The announced intent of AI @ Morgan Stanley Debrief, one of a suite of generative AI tools the company is developing for its financial advisors, is to record, transcribe and then summarize key points from the more than 1 million conference calls

article thumbnail

Get Better Network Graphs & Save Analysts Time

Many organizations today are unlocking the power of their data by using graph databases to feed downstream analytics, enahance visualizations, and more. Yet, when different graph nodes represent the same entity, graphs get messy. Watch this essential video with Senzing CEO Jeff Jonas on how adding entity resolution to a graph database condenses network graphs to improve analytics and save your analysts time.

article thumbnail

5 Free Certifications to Land Your First Developer Job

KDnuggets

So you want to become a software developer? Start coding your way through these free certifications today.

article thumbnail

Digital Whiteboards Help Companies Leverage Big Data

Smart Data Collective

Digital Whiteboards: Revolutionize your data strategy with tools that transform big data into actionable insights.

article thumbnail

The Unfinished (Data) Story

Juice Analytics

Once there was a data visualization professional who worried that translating data into intuitive visuals wasn’t enough to make him relevant. Too often, the villagers gave him slyly-condescending compliments like: “We love how you make data pretty.” The Data Visualizer sat on a tree stump deep in the woods and thought, How can I be more than a ‘drawer of pictures’?

article thumbnail

What is Grant Command in SQL?

Analytics Vidhya

Introduction When working with databases, one of the most important things to manage is who can do what within your database. Structured Query Language (SQL) has a function to help you with this. The SQL GRANT command lets you assign specific permissions to different users. This allows you to control how they interact with the […] The post What is Grant Command in SQL?

article thumbnail

Beyond the Basics of A/B Tests: Highly Innovative Experimentation Tactics You Need to Know

Speaker: Timothy Chan, PhD., Head of Data Science

Are you ready to move beyond the basics and take a deep dive into the cutting-edge techniques that are reshaping the landscape of experimentation? 🌐 From Sequential Testing to Multi-Armed Bandits, Switchback Experiments to Stratified Sampling, Timothy Chan, Data Science Lead, is here to unravel the mysteries of these powerful methodologies that are revolutionizing how we approach testing.