This site uses cookies to improve your experience. To help us insure we adhere to various privacy regulations, please select your country/region of residence. If you do not select a country, we will assume you are from the United States. Select your Cookie Settings or view our Privacy Policy and Terms of Use.
Cookie Settings
Cookies and similar technologies are used on this website for proper function of the website, for tracking performance analytics and for marketing purposes. We and some of our third-party providers may use cookie data for various purposes. Please review the cookie settings below and choose your preference.
Used for the proper function of the website
Used for monitoring website traffic and interactions
Cookie Settings
Cookies and similar technologies are used on this website for proper function of the website, for tracking performance analytics and for marketing purposes. We and some of our third-party providers may use cookie data for various purposes. Please review the cookie settings below and choose your preference.
Strictly Necessary: Used for the proper function of the website
Performance/Analytics: Used for monitoring website traffic and interactions
Which columns are problematic? Whats the overall data quality score? Most data scientists spend 15-30 minutes manually exploring each new dataset—loading it into pandas, running.info() ,describe() , and.isnull().sum() sum() , then creating visualizations to understand missing data patterns.
When we decided to build our own data platform to meet our data needs, such as supporting reporting, business intelligence (BI), and decision-making, the main challenge—and also a strict requirement—was to make sure it wouldn’t block or delay our product development. For this, we used Debezium along with a Kafka cluster.
By Cornellius Yudha Wijaya , KDnuggets Technical Content Specialist on July 25, 2025 in Data Engineering Image by Editor | ChatGPT # Introduction Machine learning has become an integral part of many companies, and businesses that dont utilize it risk being left behind. Download the data and store it somewhere for now.
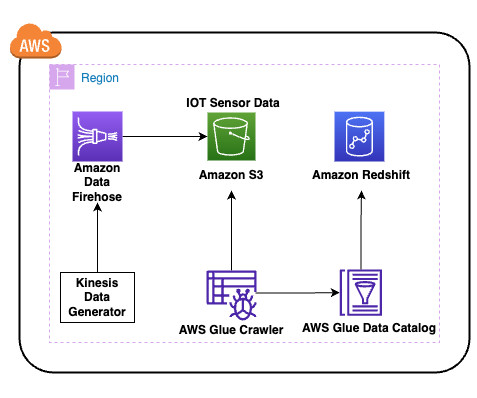
As a result, organizations collect vast amounts of data from diverse sensor devices monitoring everything from industrial equipment to smart buildings. As a result, the data structure (schema) of the information transmitted by these devices evolves continuously.
Enterprise data is brought into data lakes and data warehouses to carry out analytical, reporting, and data science use cases using AWS analytical services like Amazon Athena , Amazon Redshift , Amazon EMR , and so on. The metadata also has foreign key constraint details.
In modern data architectures, Apache Iceberg has emerged as a popular table format for data lakes, offering key features including ACID transactions and concurrent write support. Consider a common scenario: A streaming pipeline continuously writes data to an Iceberg table while scheduled maintenance jobs perform compaction operations.
In an era where data drives innovation and decision-making, organizations are increasingly focused on not only accumulating data but on maintaining its quality and reliability. By using AWS Glue Data Quality , you can measure and monitor the quality of your data. With this, you can make confident business decisions.
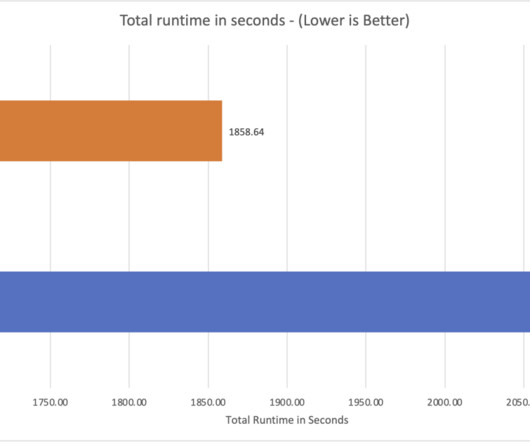
4xlarge instances, providing observable gains for data processing tasks. The fact tables used the default partitioning by the date column, which have a number of partitions varying from 2002,100. times less data from Amazon S3 and 4.1 Create Iceberg tables from the TPC-DS source data. times faster than Apache Spark 3.5.1
We’re excited to announce AWS Glue Data Catalog usage metrics. This feature provides you with immediate visibility into your AWS Glue Data Catalog API usage patterns and trends. AWS Glue Data Catalog is a centralized repository that stores metadata about your organization’s datasets.
Apache Iceberg, a high-performance open table format (OTF), has gained widespread adoption among organizations managing large scale analytic tables and data volumes. Parquet is one of the most common and fastest growing data types in Amazon S3. ORC was specifically designed for Hadoop ecosystem and optimized for Hive.
Organizations face significant challenges managing their bigdata analytics workloads. Data teams struggle with fragmented development environments, complex resource management, inconsistent monitoring, and cumbersome manual scheduling processes. Choose Data processing , then choose Add compute.
In todays data-driven world, tracking and analyzing changes over time has become essential. As organizations process vast amounts of data, maintaining an accurate historical record is crucial. History management in data systems is fundamental for compliance, business intelligence, data quality, and time-based analysis.
Data lakes were originally designed to store large volumes of raw, unstructured, or semi-structured data at a low cost, primarily serving bigdata and analytics use cases. By using features like Icebergs compaction, OTFs streamline maintenance, making it straightforward to manage object and metadata versioning at scale.
In todays data-driven world, securely accessing, visualizing, and analyzing data is essential for making informed business decisions. The Amazon Redshift Data API simplifies access to your Amazon Redshift data warehouse by removing the need to manage database drivers, connections, network configurations, data buffering, and more.
We really liked [NetSuite’s] architecture and that it’s in the cloud, and it hit the vast majority of our business requirements,” Shannon notes. The ERP modernization mandate ERP modernization is both a big undertaking and a big mandate for CIOs — and not one most relish having to do.
By Natassha Selvaraj , KDnuggets Technical Content Specialist At-Large on June 27, 2025 in Data Science Image by Editor | ChatGPT Data analytics has changed. By Natassha Selvaraj , KDnuggets Technical Content Specialist At-Large on June 27, 2025 in Data Science Image by Editor | ChatGPT Data analytics has changed.
Amazon SageMaker Lakehouse is a unified, open, and secure data lakehouse that now seamlessly integrates with Amazon S3 Tables , the first cloud object store with built-in Apache Iceberg support. You can then query, analyze, and join the data using Redshift, Amazon Athena , Amazon EMR , and AWS Glue.
The ability for organizations to quickly analyze data across multiple sources is crucial for maintaining a competitive advantage. Traditionally, answering this question would involve multiple data exports, complex extract, transform, and load (ETL) processes, and careful data synchronization across systems.
Language understanding benefits from every part of the fast-improving ABC of software: AI (freely available deep learning libraries like PyText and language models like BERT ), bigdata (Hadoop, Spark, and Spark NLP ), and cloud (GPU's on demand and NLP-as-a-service from all the major cloud providers). are written in English.
This year, we expanded our partnership with NVIDIA , enabling your data teams to dramatically speed up compute processes for data engineering and data science workloads with no code changes using RAPIDS AI. As a machine learning problem, it is a classification task with tabular data, a perfect fit for RAPIDS.
2) Charts And Graphs Categories 3) 20 Different Types Of Graphs And Charts 4) How To Choose The Right Chart Type Data and statistics are all around us. That is because graphical representations of data make it easier to convey important information to different audiences. Let’s start this journey by looking at a definition.
Amazon Redshift is a fast, scalable, secure, and fully managed cloud data warehouse that makes it simple and cost-effective to analyze all your data using standard SQL and your existing ETL (extract, transform, and load), business intelligence (BI), and reporting tools.
Athena provides a simplified, flexible way to analyze petabytes of data where it lives. You can analyze data or build applications from an Amazon Simple Storage Service (Amazon S3) data lake and 30 data sources, including on-premises data sources or other cloud systems using SQL or Python.
This integration reduces the overall time spent in writing data integration and extract, transform, and load (ETL) logic. AWS Glue Studio notebooks allows you to author data integration jobs with a web-based serverless notebook interface. It also helps beginner-level programmers write their first lines of code.
One of such research paper types that college students may have to write is a research paper on bigdata. If you have to write a research paper on bigdata as a college student, the first thing to note is that it’s not something you’re familiar about if you don’t major in data science or computer science.
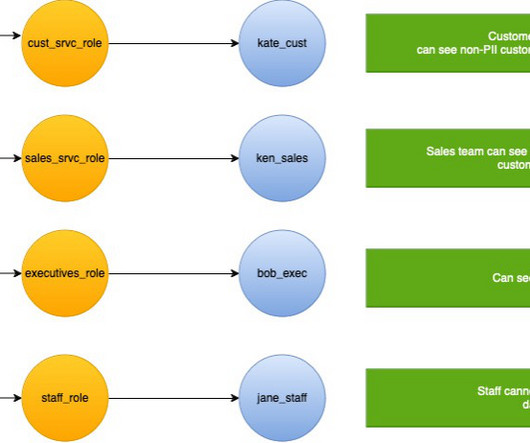
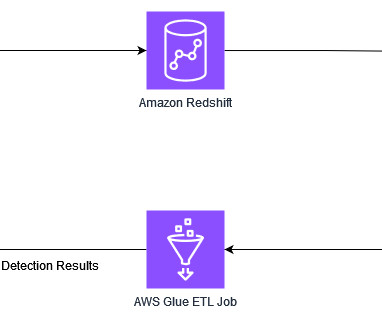
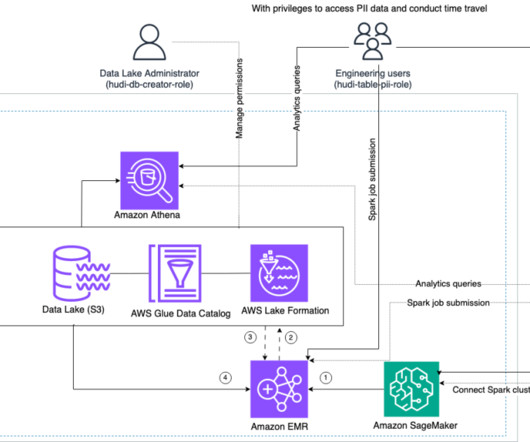
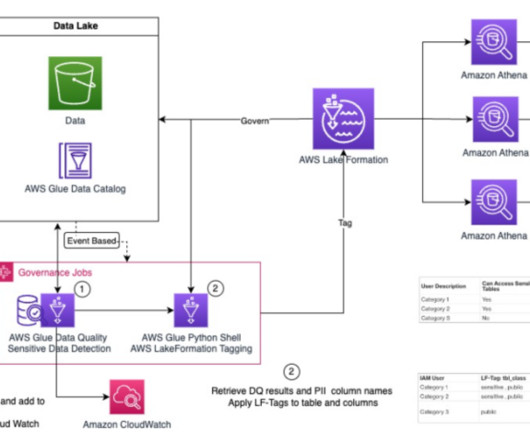
With the exponential growth of data, companies are handling huge volumes and a wide variety of data including personally identifiable information (PII). Identifying and protecting sensitive data at scale has become increasingly complex, expensive, and time-consuming. For our solution, we use Amazon Redshift to store the data.
You can ingest and integrate data from multiple Internet of Things (IoT) sensors to get insights. However, you may have to integrate data from multiple IoT sensor devices to derive analytics like equipment health information from all the sensors based on common data elements.
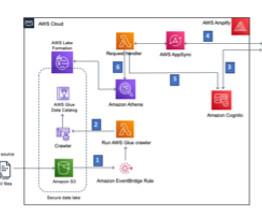
In today’s world, customers manage vast amounts of data in their Amazon Simple Storage Service (Amazon S3) data lakes, which requires convoluted data pipelines to continuously understand the changes in the data layout and make them available to consuming systems. Note down values of DatabaseName and GlueCrawlerName.
Z-order is an ordering for multi-dimensional data, e.g. rows in a database table. Once data is in Z-order it is possible to efficiently search against more columns. But the version of page index filtering that we described could only search efficiently against a limited number of columns. Which are those columns?
This blog is centered around creating incredible digital experiences powered by qualitative and quantitative data insights. Every post is about unleashing the power of digital analytics (the potent combination of data, systems, software and people). Analysts: Put up or shut up time! Isn't it amazing? 400% ROI, not bad.
NOTE: This page is a WIP = Work In Progress.). AGI (Artificial General Intelligence): AI (Artificial Intelligence): Application of Machine Learning algorithms to robotics and machines (including bots), focused on taking actions based on sensory inputs (data). 4) Credit Card Fraud Alerts. (5) 5) Chatbots (Conversational AI). See [link].
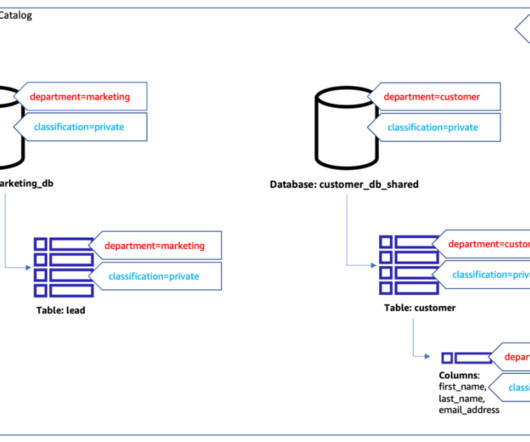
This allows you to simplify security and governance over transactional data lakes by providing access controls at table-, column-, and row-level permissions with your Apache Spark jobs. Many large enterprise companies seek to use their transactional data lake to gain insights and improve decision-making.
Amazon Redshift is a fast, fully managed petabyte-scale cloud data warehouse that makes it simple and cost-effective to analyze all your data using standard SQL and your existing business intelligence (BI) tools. Amazon Redshift also supports querying nested data with complex data types such as struct, array, and map.
Data lakes have been gaining popularity for storing vast amounts of data from diverse sources in a scalable and cost-effective way. As the number of data consumers grows, data lake administrators often need to implement fine-grained access controls for different user profiles.
Data governance is the process of ensuring the integrity, availability, usability, and security of an organization’s data. Due to the volume, velocity, and variety of data being ingested in data lakes, it can get challenging to develop and maintain policies and procedures to ensure data governance at scale for your data lake.
Data-driven organizations treat data as an asset and use it across different lines of business (LOBs) to drive timely insights and better business decisions. This leads to having data across many instances of data warehouses and data lakes using a modern data architecture in separate AWS accounts.
DataBrew is a visual data preparation tool that enables you to clean and normalize data without writing any code. In DataBrew, a recipe is a set of data transformation steps that you can author interactively in its intuitive visual interface. Create a DataBrew recipe Start by registering the data store for the claims file.
Events and many other security data types are stored in Imperva’s Threat Research Multi-Region data lake. Imperva harnesses data to improve their business outcomes. As part of their solution, they are using Amazon QuickSight to unlock insights from their data.
One of the most effective ways to improve performance and minimize cost in database systems today is by avoiding unnecessary work, such as data reads from the storage layer (e.g., disks, remote storage), transfers over the network, or even data materialization during query execution. CDP Runtime 7.2.9 CDP Runtime 7.2.9
Cloudera delivers an enterprise data cloud that enables companies to build end-to-end data pipelines for hybrid cloud, spanning edge devices to public or private cloud, with integrated security and governance underpinning it to protect customers data. Dynamic row filtering & column masking. Ranger 2.0.
Apache Flink and Apache Spark are both open-source, distributed data processing frameworks used widely for bigdata processing and analytics. Spark is known for its ease of use, high-level APIs, and the ability to process large amounts of data. Flink also allows seamless transition and switching across these APIs.
Data is essential for businesses to make informed decisions, improve operations, and innovate. Integrating data from different sources can be a complex and time-consuming process. AWS Glue provides different authoring experiences for you to build data integration jobs. One of the most common options is the notebook.
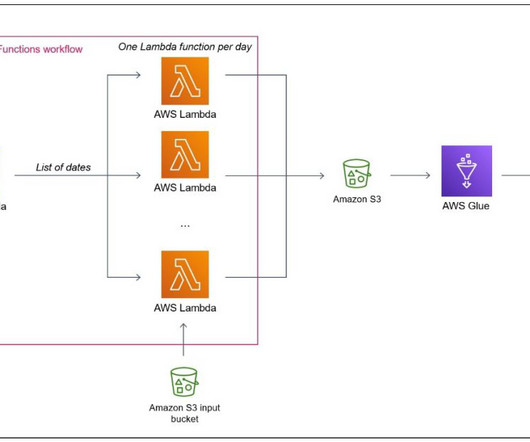
Extracting time series on given geographical coordinates from satellite or Numerical Weather Prediction data can be challenging because of the volume of data and of its multidimensional nature (time, latitude, longitude, height, multiple parameters). Note that Lambda is a general purpose serverless engine.
There are few things more complicated in analytics (all analytics, bigdata and huge data!) There is lots of missing data. And as if that were not enough, there is lots of unknowable data. Look at the last column: Assisted/Last Click or Direct Conversions. • than multi-channel attribution modeling.
We organize all of the trending information in your field so you don't have to. Join 42,000+ users and stay up to date on the latest articles your peers are reading.
You know about us, now we want to get to know you!
Let's personalize your content
Let's get even more personalized
We recognize your account from another site in our network, please click 'Send Email' below to continue with verifying your account and setting a password.


Let's personalize your content