This site uses cookies to improve your experience. To help us insure we adhere to various privacy regulations, please select your country/region of residence. If you do not select a country, we will assume you are from the United States. Select your Cookie Settings or view our Privacy Policy and Terms of Use.
Cookie Settings
Cookies and similar technologies are used on this website for proper function of the website, for tracking performance analytics and for marketing purposes. We and some of our third-party providers may use cookie data for various purposes. Please review the cookie settings below and choose your preference.
Used for the proper function of the website
Used for monitoring website traffic and interactions
Cookie Settings
Cookies and similar technologies are used on this website for proper function of the website, for tracking performance analytics and for marketing purposes. We and some of our third-party providers may use cookie data for various purposes. Please review the cookie settings below and choose your preference.
Strictly Necessary: Used for the proper function of the website
Performance/Analytics: Used for monitoring website traffic and interactions
Gathering data and information from one or multiple platforms and creating a comprehensive social media dashboard is equally important as creating the social content itself. Here we will present a social media dashboard definition, a guide on how to create one, and finalize with social media dashboard templates at the end of the article.
By utilizing recruiting KPIs presented through the medium of visual and interactive HR dashboards , it’s possible to use recruitment metrics to better interpret and evaluate a variety of talent acquisition factors that aid in hiring processes. Exclusive Bonus Content: What are recruiting metrics & dashboards for?
1) What Is A Small Business Dashboard? 3) Why Do You Need Small Business Dashboards. 4) Small Business Dashboard & KPIs Examples. Enter small business dashboards and metrics. BI dashboard tools provide smaller businesses with valuable insights regarding their operations thanks to real-time access to data.
My last post, perhaps provocatively, called for a reduction of data in executive dashboards (digital, online, offline). Here's the post: Strategic & Tactical Dashboards: Best Practices, Examples. In the post Adil commented that he's observed that attribution modeling is missing from most web analytics dashboards.
I'm excited about the power of a well created dashboard. Dashboards are every where, we will look at a lot of them in this post and they are all digital. Here's a great dashboard, for the Museum of Art… take a minute to ponder it… Isn't it pretty awesome? And data pukes are not dashboards.
That said, we will go into details of a marketing campaign report, provide a digital marketing report template, and look into marketing reporting and analysis with the help of carefully created dashboards. It shows how targets are performing in a monthly view, but the user can easily set this marketing dashboard to a yearly time frame.
Visual marketing dashboards are prime examples of using big data effectively in marketing. In this day and age, all businesses must pay especially close consideration to the performance of their marketing metrics dashboard. In this article, we will discuss what l needs to be included in marketing reporting dashboards.
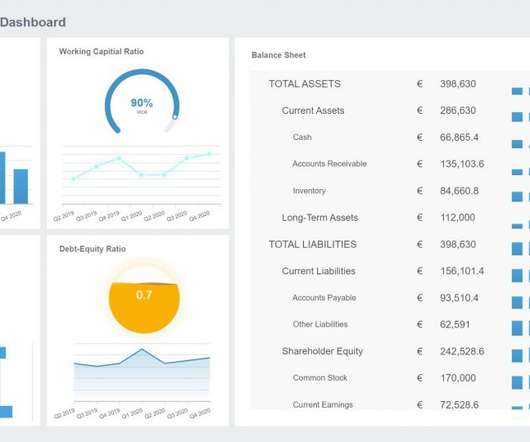
If you want to convey crucial information to decision-makers in the easiest and most effective way possible, you need to embrace the power of interactive dashboards. A business dashboard offers at-a-glance insights based on key performance indicators (KPIs) and is an intuitive and visually pleasing way to consume data.
3) “The Big Book Of Dashboards: Visualizing Your Data Using Real-World Business Scenarios” by Steve Waxler, Jeffrey Shaffer, and Andy Cotgreave. Our next best book to learn data visualization is the “The Big Book Of Dashboards”. It is a definitive reference for anyone who wants to master the art of dashboarding.
A host of business intelligence concepts are executed through intuitive, interactive tools and dashboards – a centralized space that provides the ability to drill down into your data with ease. Data dashboarding and reporting. 4) Data dashboarding and reporting. But more on that later. The data warehouse. 1) The raw data.
Turning these datasets into a business dashboard can effectively track the right values and offer a comprehensive application to the entire business system. The CPC (cost-per-click) overview of campaigns is an operational metric that expounds on the standard pricing model in online advertising. Marketing: Is my budget on track?
In the matter, data analysis and dashboard designer software is a precious ally. We will finish by presenting a business dashboard that will show how those metrics work together when depicting an inventory data-story. Inventory Metrics Examples On Dynamic Dashboards. a) Inventory analytics dashboard for supply chain.
Today, more and more businesses are turning to online data visualizations such as a dashboard creator that is user-friendly and accessible for everyone. For instance, the top part of the dashboard provides insights into the performance of your sales team. Let’s kick it off with the definition. Weekly Marketing Report.
While using a business dashboard, all your information can be simplified into a single place, making the time for meaningful decisions much faster. BI dashboards , offer the possibility to filter the data all in one screen to extract deeper conclusions. Asking the right business intelligence questions will lead you to better analytics.
Dashboard monitoring tool can be your wonderful aid. What is dashboard monitoring tool? Dashboard monitoring tool enables enterprises to monitor digital marketing channels and business performance easily and effectively. All companies have to do to achieve this function is to combine data into a single, beautiful dashboard.
These metrics are utilized by marketing teams to assess their efforts in all critical areas of social media-based performance, including engagement and advertising. to brand mentions and platform traffic, all through the use of a marketing dashboard (or social media KPI dashboard, as it’s also known). 2) Number of fans.
Such an approach will require blending in data with digital technology so that your customers get more value from your services, advertising, and offers. Several marketing dashboard tools allow you to generate automated online dashboards and reports to track your most relevant KPIs in one place. Pay Per Click (PPC).
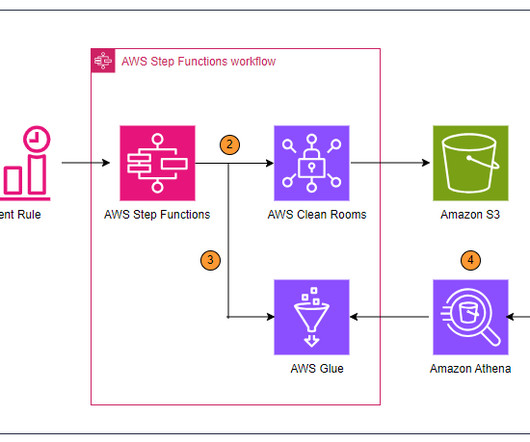
Instead, they rely on up-to-date dashboards that help them visualize data insights to make informed decisions quickly. Manually handling repetitive daily tasks at scale poses risks like delayed insights, miscataloged outputs, or broken dashboards. At a large volume, it would require around-the-clock staffing, straining budgets.
With these user-friendly online dashboards , you will see how each interface is intuitive, navigable, and simple to customize. a) Facebook Page Dashboard. To find out more about this social media report template, explore our Facebook dashboards in greater detail. b) Facebook Post Dashboard. click to enlarge**.
A recent LinkedIn job search showed over 950 positions advertised for job candidates with DataOps experience. When analytics and dashboards are inaccurate, business leaders may not be able to solve problems and pursue opportunities. A DataOps Engineer can have a significant impact on the productivity of the data organization.
Using the right dashboard and data visualizations, it’s possible to hone in on any trends or patterns that uncover inefficiencies within your processes. That said, working with the right applications and data dashboard tools will facilitate goods management planning as well as geographical coverage between different locations in the network.
For example, the image above shows a management dashboard with 5 number charts on the top. To keep putting the value of these important analytical features into perspective let’s see each of them in action with some examples generated with dashboard software. click to enlarge**. Drill Down Report Examples. Profit per product category.
By working with relevant key performance indicators (KPIs) and data dashboards , you’ll be able to track, monitor, and measure your most valuable business insights in a way that is clear, concise, and digestible, pulling from past, present, and predictive data. Panoramic vision. channels like Animal Planet.
Using a professional business intelligence dashboard that works with real-time data will always let you up to date when sharing your insights. To make it easy to grasp in a simple glance, instead of adding up one after another a succession of graphs, you should opt for the overview that provides a dashboard.
Generative AI across all products in Advertising and CX Cloud Oracle is adding generative AI capabilities across all the products inside its Advertising and Customer Experience Cloud (Fusion Cloud CX), which comes with applications designed for advertising, marketing, sales, service, and customer experience processes and functions.
Several ways to implement this strategy include paid advertising, influencer marketing, and content marketing. Paid social media advertising. You have to work harder to get a high ROI with social media advertising than with organic content, because you have to spend money on ads. Influencer marketing. Remarketing.
In the realm of big data utilization , we often romanticize its profound impact, envisioning scenarios like precision-targeted advertising, streamlined social security management, and the intelligent evolution of the pharmaceutical sector. Try FineReport Now 1.1 Try FineReport Now 1.1
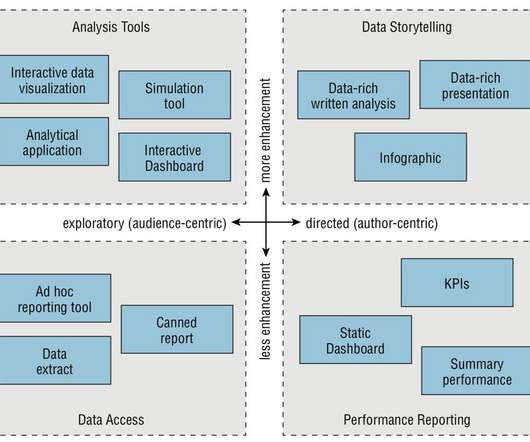
There are many choices: Dashboards Reports Self-service BI tools Predictive models One-off analyses using slides Spreadsheet models It is a confusing array of ways to deliver data to these data consumers. And if there is one truism in analytics, it is: Good analytics generates better questions. What’s the right tool for the job?
There is an old saying in the marketing industry: “I know that half of the advertising costs are wasted, but I don’t know which half is wasted.” Types of marketing reports How to write a marketing report/dashboard? A similar idea is the marketing dashboard. Marketing Report(Dashboard) Template- from FineReport.
Leading companies make use of KPIs and KPI dashboards to measure their efficiency in real time. We just track them with higher precision and accuracy using specialized KPI dashboards. Most people use specialized dashboards to help them manage their KPIs and data. How an Operations Dashboard Can Streamline Your Reporting.
What About Social Media Advertising? If you are engaging in brand advertising on social media channels then the metrics you should solve for should be the first three. Update: Bonus: Erik Ohlen was inspired by this blog post to create a very simple, and effective, dashboard where you can track the four recommended social media metrics.
This is a common practice in the media, advertising, and politics, where values are manipulated to make the audiences believe certain conclusions. The interactive (or dynamic) bar chart is basically a traditional bar chart that can be explored in real-time using interactive dashboard filters.
Most of the time when I look at the dashboards and reporting efforts in companies, they are usually obsessed with one of these pieces or maybe even a couple. For Acquisition, advertising you buy on YouTube, the metrics to use would be Impressions and Click-thru Rate. Why would you advertise on your temporary social channels?
Data analytics is widely used in business since it allows organizations to better understand their consumers and improve their advertising strategies. How can dashboards help them overcome obstacles? Resist the urge to create generic dashboards and instead make sure they meet the needs of decision-makers.
As technology advances, the use of data-driven dashboards is becoming increasingly important. Metrics dashboards enable you and your team to track the effectiveness of various tactics, campaigns, and processes. Dashboard metrics from FineReport. What is dashboard metrics. It uses a performance metrics dashboard.
Here’s an analytics truism: everyone wants a dashboard (a.k.a. Sprint Advertising Campaign. Presentation matters Your dashboard should be easy to understand and provide enough data to give your audience context. Juicebox dashboard. key performance indicators (a.k.a KPIs), success metrics, scorecards). Evolve to goals.
An HR dashboard functions as an advanced analytics tool that utilizes interactive data visualizations to present crucial HR metrics. By adopting a professional online dashboard, HR professionals gain the ability to closely monitor employee performance, recruitment activities, and talent management processes. What is an HR Dashboard?
The Advertising Ecosystem: Passive Consumption. The Advertising Ecosystem: Passive Consumption. These are important questions facets of, and delivery optimization of, the advertising. Over 90% of advertising is passive consumption. almost all of the advertising does not elicit any sort of interactivity.
Social media, email, web-based advertising brings numberless data to companies. Through an intuitive BI dashboard , the marketing team could adjust from reality and make up customer-based sales strategies. Marketing Dashboard (From FineReport?. The digital marketing era is coming. Welcome to have a free trial. Free Download.
A vast majority of occasions where data is presented (reports, executive dashboards, conference presentations, or just plain here's a automated emailed thingy from Google Analytics ) end up being abject failures because most of the discussion is still about the data. Focus on Economic Value from your search advertising.
To put our definition into a real-world perspective, here’s a hypothetical incremental sales example we’ve created for reference: A green clothing retailer typically sells $14,000 worth of ethical sweaters per month without investing in advertising.
You can use their sophisticated analytics dashboard to improve your marketing strategies. Data Analytics Can Improve the Performance of Your LinkedIn Advertising. This creates a lot of advantages for its advertisers. This is especially true for companies using digital marketing practices, such as social media.
Ideally, this data extracted by BI should provide marketers with information on advertisement trends, audience engagement with creatives, and resource allocation. In this way, users get all their data on their advertising campaigns in one place. They can turn mountains of data from absolutely puzzling mess to a pretty coherent picture.
Create a Customized Dashboard – Earn Love, Drive Change. #2. Create a Customized Dashboard – Earn Love, Drive Change! Who does not love dashboards? Pledge to shift away from a one-size-fits-all data puke, and use your web analytics tool to create a customized dashboard. Then click on Dashboards, and what do you see?
We organize all of the trending information in your field so you don't have to. Join 42,000+ users and stay up to date on the latest articles your peers are reading.
You know about us, now we want to get to know you!
Let's personalize your content
Let's get even more personalized
We recognize your account from another site in our network, please click 'Send Email' below to continue with verifying your account and setting a password.


Let's personalize your content