This site uses cookies to improve your experience. To help us insure we adhere to various privacy regulations, please select your country/region of residence. If you do not select a country, we will assume you are from the United States. Select your Cookie Settings or view our Privacy Policy and Terms of Use.
Cookie Settings
Cookies and similar technologies are used on this website for proper function of the website, for tracking performance analytics and for marketing purposes. We and some of our third-party providers may use cookie data for various purposes. Please review the cookie settings below and choose your preference.
Used for the proper function of the website
Used for monitoring website traffic and interactions
Cookie Settings
Cookies and similar technologies are used on this website for proper function of the website, for tracking performance analytics and for marketing purposes. We and some of our third-party providers may use cookie data for various purposes. Please review the cookie settings below and choose your preference.
Strictly Necessary: Used for the proper function of the website
Performance/Analytics: Used for monitoring website traffic and interactions
Data is the most significant asset of any organization. However, enterprises often encounter challenges with data silos, insufficient access controls, poor governance, and quality issues. Embracing data as a product is the key to address these challenges and foster a data-driven culture.
Today’s digital data has given the power to an average Internet user a massive amount of information that helps him or her to choose between brands, products or offers, making the market a highly competitive arena for the best ones to survive. First things first – organizing and prioritizing your marketing data.
Big data is changing the entire nature of decision-making across organizations of all sizes. Companies on either side of the world have identified countless applications for big data, which is helping them save considerable amounts of money and get better ROIs from various assets. Big Data is the Foundation of Modern Decision-making.
Big data has been incredibly important in the marketing profession. Marketers need to rely heavily on big data technology to reach customers more effectively. Big data technology isn’t just important for making better insights. Visual marketing dashboards are prime examples of using big data effectively in marketing.
It is because often we are just the data girls / boys. But you don't own anything else (data, relationship, creativity, etc. Much less conversion driven, much more brand marketing driven, and much more longer term focused in terms of impact and outcome. Why would you advertise on your temporary social channels?
In our world of digital analytics often these things are called dashboards… I had to shrink the size to make it fit the available screen, but even if you saw it at full glorious resolution, I'm sure you'll very quickly come to the conclusion that this is just a data puke. Yes, it does summarize data from many reports into one.
“Without big data, you are blind and deaf and in the middle of a freeway.” – Geoffrey Moore, management consultant, and author. In a world dominated by data, it’s more important than ever for businesses to understand how to extract every drop of value from the raft of digital insights available at their fingertips.
However, computerization in the digital age creates massive volumes of data, which has resulted in the formation of several industries, all of which rely on data and its ever-increasing relevance. Data analytics and visualization help with many such use cases. It is the time of big data. What Is Data Analytics?
Using data in today’s businesses is crucial to evaluate success and gather insights needed for a sustainable company. By establishing clear operational metrics and evaluate performance, companies have the advantage of using what is crucial to stay competitive in the market, and that’s data. Who will measure it?
Because things are changing and becoming more competitive in every sector of business, the benefits of business intelligence and proper use of data analytics are key to outperforming the competition. BI software uses algorithms to extract actionable insights from a company’s data and guide its strategic decisions.
Recruitment analytics is a process of using data-driven metrics and insights to improve the sourcing of the best candidates for different roles within your organization that will help you cut costs and better understand factors that are influencing your hiring process. Let’s get started. What Is Recruitment Analytics?
4) Top Elements Of A Weekly Performance Report. Businesses have been analyzing their performance for decades through traditional written reports, but with the amount of data being produced every day, the need for more frequent reporting is growing. 3) Weekly Report Templates & Examples.
Exclusive Bonus Content: Ready to use data analytics in your restaurant? Get our free bite-sized summary for increasing your profits through data! By managing your information with data analysis tools , you stand to sharpen your competitive edge, increase your profitability, boost profit margins, and grow your customer base.
Regardless of where organizations are in their digital transformation, CIOs must provide their board of directors, executive committees, and employees definitions of successful outcomes and measurable keyperformanceindicators (KPIs). Efficiency metrics might show the impacts of automation and data-driven decision-making.
Consider that Display advertising is a tiny part of your budget. Media Costs is the amount you have to spend on advertising (a category that also includes your Owned and Earned efforts – after all SEO, Email, Organic Social all cost money). You can build this into Google’s Data Studio if you like. Wait a minute. No siree, Bob!
Incremental Sales Calculation As mentioned, incremental sales are used by businesses as a keyperformanceindicator to measure the financial success of their promotional efforts. In November, while running an advertising campaign that cost $1,500, the retailer sells $20,000 worth of ethical sweaters online.
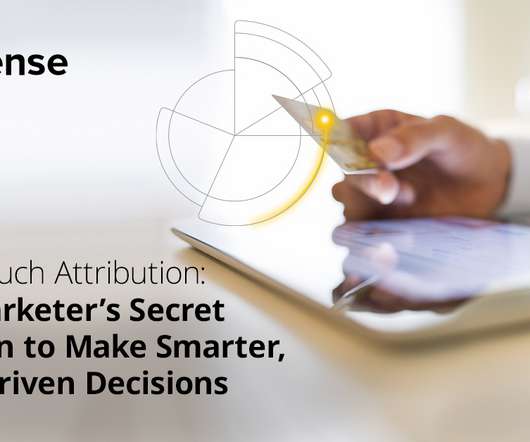
Your customers interact with multiple campaigns: They start with a TV ad, see a Facebook ad, see a Google Ad two days later, discover an SEO-driven blog article, and finally click on an email discount offer to make a purchase. Get a unified view of all your marketing data sources. Learn more. MTA introduces a new way of thinking.
Culture is a stronger determinant of success with data than anything else. Including data. People + Process + Structure] > [Data + Technology]. You want to win big with data, with marketing, with transformative digital yada yada and blah blah, evolve. Step 6: Data-driven Attribution Modeling.
However, SaaS architectures can easily overwhelm DevOps teams with data aggregation, sorting and analysis tasks. Broadly speaking, application analytics refers to the process of collecting application data and performing real-time analysis of SaaS, mobile, desktop and web application performance and usage data.
A business dashboard offers at-a-glance insights based on keyperformanceindicators (KPIs) and is an intuitive and visually pleasing way to consume data. Unlike early predecessors, they give presenters the ability to engage audiences with real-time data. How familiar they are with the data or KPIs.
As technology advances, the use of data-driven dashboards is becoming increasingly important. As a result, they allow you to improve your plans and act on the data in real-time. These KPI metrics are critical data to analyze and evaluate a company’s sales, human resources, and marketing, and operational activities.
An insurance KeyPerformanceIndicator (KPI) or metric is a measure that an insurance company uses to monitor its performance and efficiency. The second is how much of the company’s growth is organic as opposed to being advertisementdriven. Compiling the data and reporting it. Have a goal.
2) Charts And Graphs Categories 3) 20 Different Types Of Graphs And Charts 4) How To Choose The Right Chart Type Data and statistics are all around us. It is very likely that you have found yourself looking at a chart or graph at work, in the news, sports, media, advertising, and many other places at some point in your life.
These tools allowed users to monitor keyperformanceindicators (KPIs), reports and other metrics in a dashboard environment using many of the same features and tools they enjoyed in a desktop based application. The market is forecasted to achieve nearly a 23% growth over the next three years.
Collect customer feedback Collect, analyze and distribute customer data through reviews and surveys. For CRMs, they can use AI and machine learning to automate the retrieval and analysis of customer data they’ve collected. It’s also important to track and analyze social media conversations about your brands.
An HR dashboard functions as an advanced analytics tool that utilizes interactive data visualizations to present crucial HR metrics. Its primary objective is to enhance the HR department’s recruitment processes, optimize workplace management, and improve overall employee performance.
Rapid technological advancements and extensive networking have propelled the evolution of data analytics, fundamentally reshaping decision-making practices across various sectors. In this landscape, data analysts assume a pivotal role, tasked with interpreting data to drive informed decision-making.
We've seen explosive growth in brand pages, types of advertising and other fun ways to monetize this audience. From the data presented, there is no way to tell if the Facebook campaign worked or not. Based on results of value identified for Facebook, optimize their advertising mix strategy for future product launches.
Moreover, interactive HR dashboard templates offer businesses the means to better understand their personnel, spot emerging problems or issues, and deploy proactive solutions to manage their HR departments in a more fluent, result-driven fashion. Every good conversation starts with listening.” – Tom Haak. What Is An HR Report?
Truly reflect on whether our marketing and advertising initiatives are broad enough and optimized enough for each customer consideration stage, and finally. And that comes before you think about marketing/sales/advertising/billboards/tv. You get competitive data, and you help me too. It starts with a question.
The very best analysts are know what matter’s the most are not the insights from big data but clear actions and compelling business impact from usually a smaller subset of keydata. People ask me this seemingly simple question all the time: What KeyPerformanceIndicators should we use for our business ?
My last post, perhaps provocatively, called for a reduction of data in executive dashboards (digital, online, offline). More English (IABI, specifically) would lead to a smarter understanding of performance, and of course glory for data practitioners. Data above is for a B2B website with no ecommerce. Your boss loves you.
A story where data is the hero, followed by two mind-challenging business-shifting ideas. A KeyPerformanceIndicator (KPI), our industry’s lingo for what becomes The metric, has massive influence. Applying it to digital advertising…. Leverage advertising solutions like RLSA. Humans are pavlovian.
Web Analysts are blessed with an immense amount of data, and an amazing amount of valuable, even sexy, metrics to understand business performance. You: The person responsible for "providing data" / "analyzing metrics" / "reporting." Why not seek direct success indicators? ."
Yes, data is important. While there is a great deal of appreciation for the power of metrics/data, I've come to realize that Sr. Leaders don't quite appreciate the deep, and often corrosive, consequences of choosing metric x over metric y as a keyperformanceindicator (KPI). Helps make marketing better.
A chief executive officer (CEO) keyperformanceindicator (KPI) or metric is a relative performance measure that a CEO will use to make informed decisions. Will tracking these data create synergies between departments? It is best practice to integrate the performance metrics into the existing company framework.
We organize all of the trending information in your field so you don't have to. Join 42,000+ users and stay up to date on the latest articles your peers are reading.
You know about us, now we want to get to know you!
Let's personalize your content
Let's get even more personalized
We recognize your account from another site in our network, please click 'Send Email' below to continue with verifying your account and setting a password.


Let's personalize your content