This site uses cookies to improve your experience. To help us insure we adhere to various privacy regulations, please select your country/region of residence. If you do not select a country, we will assume you are from the United States. Select your Cookie Settings or view our Privacy Policy and Terms of Use.
Cookie Settings
Cookies and similar technologies are used on this website for proper function of the website, for tracking performance analytics and for marketing purposes. We and some of our third-party providers may use cookie data for various purposes. Please review the cookie settings below and choose your preference.
Used for the proper function of the website
Used for monitoring website traffic and interactions
Cookie Settings
Cookies and similar technologies are used on this website for proper function of the website, for tracking performance analytics and for marketing purposes. We and some of our third-party providers may use cookie data for various purposes. Please review the cookie settings below and choose your preference.
Strictly Necessary: Used for the proper function of the website
Performance/Analytics: Used for monitoring website traffic and interactions
Overview Microsoft Excel is an excellent tool for learning and executing statistical functions Here are 12 statistical functions in Excel that you should master. The post 10 Statistical Functions in Excel every Analytics Professional Should Know appeared first on Analytics Vidhya.
Introduction What’s the most important skill you need to succeed in the analytics domain? The post 9 Key Skills Every BusinessAnalytics Professional Should Have appeared first on Analytics Vidhya. I’ve seen this question floating around everywhere – our discussion.
Decades (at least) of businessanalytics writings have focused on the power, perspicacity, value, and validity in deploying predictive and prescriptive analytics for business forecasting and optimization, respectively. What is the point of those obvious statistical inferences? How does that work in practice?
With the growth of business data, it is no longer surprising that AI has penetrated data analytics and business insight tools. Business insight and data analytics landscape. Artificial intelligence and allied technologies make business insight tools and data analytics software more efficient.
What is businessanalytics? Businessanalytics is the practical application of statistical analysis and technologies on business data to identify and anticipate trends and predict business outcomes. The discipline is a key facet of the business analyst role. Businessanalytics techniques.
Spreadsheets finally took a backseat to actionable and insightful data visualizations and interactive business dashboards. The rise of self-service analytics democratized the data product chain. Suddenly advanced analytics wasn’t just for the analysts. 2019 was a particularly major year for the business intelligence industry.
1) What Is Business Intelligence And Analytics? 4) How Do BI And BA Apply To Business? If someone puts you on the spot, could you tell him/her what the difference between business intelligence and analytics is? We already saw earlier this year the benefits of Business Intelligence and BusinessAnalytics.
Introduction One of the most basic concepts in statistics is hypothesis testing. The post Hypothesis Testing: A Way to Prove Your Claim Using p-value appeared first on Analytics Vidhya. Not just in Data Science, Hypothesis testing is important in every field.
The determination of winners and losers in the data analytics space is a much more dynamic proposition than it ever has been. But more significant has been the acceleration in the number of dynamic, real-time data sources and corresponding dynamic, real-time analytics applications. Well, that statement was made five years ago!
In recent years, analytical reporting has evolved into one of the world’s most important business intelligence components, compelling companies to adapt their strategies based on powerful data-driven insights. What Is An Analytical Report? Your Chance: Want to build your own analytical reports completely free?
What is data analytics? Data analytics is a discipline focused on extracting insights from data. The chief aim of data analytics is to apply statistical analysis and technologies on data to find trends and solve problems. What are the four types of data analytics?
This is where BusinessAnalytics (BA) and Business Intelligence (BI) come in: both provide methods and tools for handling and making sense of the data at your disposal. So…what is the difference between business intelligence and businessanalytics? What Does “BusinessAnalytics” Mean?
In June of 2020, Database Trends & Applications featured DataKitchen’s end-to-end DataOps platform for its ability to coordinate data teams, tools, and environments in the entire data analytics organization with features such as meta-orchestration , automated testing and monitoring , and continuous deployment : DataKitchen [link].
I recently saw an informal online survey that asked users what types of data (tabular; text; images; or “other”) are being used in their organization’s analytics applications. This was not a scientific or statistically robust survey, so the results are not necessarily reliable, but they are interesting and provocative.
To fully leverage the power of data science, scientists often need to obtain skills in databases, statistical programming tools, and data visualizations. Thanks to modern data analysis tools , today the costs are decreased since all the data is stored on a cloud and speeds up the process to make better business decisions.
Big data, analytics, and AI all have a relationship with each other. For example, big data analytics leverages AI for enhanced data analysis. Brands are closely working to solve this as they dive deep into the world of big data analytics. What is the relationship between big data analytics and AI? Businessanalytics.
As companies striving to embrace digital transformation and become data-driven, business intelligence and analytics skills and experience are essential to building a data-savvy team. However, if someone puts you on the spot, can you clearly tell the difference between business intelligence and analytics? Definition.
Exclusive Bonus Content: Ready to use data analytics in your restaurant? In a previous study into big data examples in real life, we explored how the catering industry could benefit from the use of restaurants analytics – a topic that we’re going to delve deeper into here. A sobering statistic if ever we saw one.
The post 10+ Simple Yet Powerful Excel Tricks for Data Analysis appeared first on Analytics Vidhya. Overview Microsoft Excel is one of the most widely used tools for data analysis Learn the essential Excel functions used to analyze data for.
Analytics technology is incredibly important in almost every facet of business. Virtually every industry has found some ways to utilize analytics technology, but some are relying on it more than others. The e-commerce sector is among those that has relied most heavily on analytics technology.
many of our articles have centered around the role that data analytics and artificial intelligence has played in the financial sector. The Sports Analytics Market is expected to be worth over $22 billion by 2030. Data analytics can impact the sports industry and a number of different ways. The sports industry is among them.
In the early days of analytics, only the largest companies could afford to leverage big data. All that’s changed and now there are accessible tools for businesses of all sizes. But which tools are the most effective for businesses in 2021? 5 Best Analytic Tools in 2021. Choosing an Analytics Tool.
Each aspect of data science, like data preparation, the importance of big data, and the process of automation, contributes to how data science is the future […] The post 30 Best Data Science Books to Read in 2023 appeared first on Analytics Vidhya.
Since then, customer demands for better scale, higher throughput, and agility in handling a wide variety of changing, but increasingly business critical analytics and machine learning use cases has exploded, and we have been keeping pace. Let’s dive into the highlights.
Business intelligence definition Business intelligence (BI) is a set of strategies and technologies enterprises use to analyze business information and transform it into actionable insights that inform strategic and tactical business decisions. This gets to the heart of the question of who business intelligence is for.
Certified Business Intelligence Professional IBM Data Analyst Professional Certificate Microsoft Certified: Power BI Data Analyst Associate QlikView Business Analyst SAP Certified Application Associate: SAP BusinessObjects Business Intelligence Platform 4.3 SAS Certified Specialist: Visual BusinessAnalytics Specialist.
Smarten is pleased to announce the launch of its Mobile Application for Smarten Augmented Analytics. Smarten CEO, Kartik Patel says, “The availability of Smarten augmented analytics on a mobile device encourages user adoption and provides support for business intelligence investments and data democratization.”
Business intelligence (BI) analysts transform data into insights that drive business value. It’s a role that combines hard skills such as programming, data modeling, and statistics with soft skills such as communication, analytical thinking, and problem-solving.
Though you may encounter the terms “data science” and “data analytics” being used interchangeably in conversations or online, they refer to two distinctly different concepts. Data science is an area of expertise that combines many disciplines such as mathematics, computer science, software engineering and statistics.
Data interpretation refers to the process of using diverse analytical methods to review data and arrive at relevant conclusions. More often than not, it involves the use of statistical modeling such as standard deviation, mean and median. Standard deviation: this is another statistical term commonly appearing in quantitative analysis.
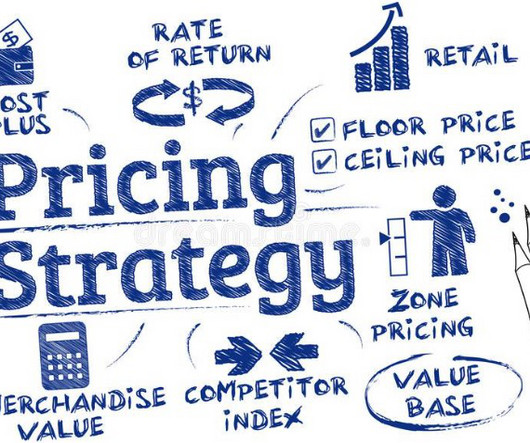
Learning Objectives After reading this article, learners will […] The post Price Optimization in E-Commerce appeared first on Analytics Vidhya. In an increasingly competitive e-commerce landscape, effective price optimization can be a significant differentiator.
360 Orlando and I’m presenting a workshop on From Business Intelligence to BusinessAnalytics with the Microsoft Data Platform. Data becomes relevant for decision making when we start to use it properly, so this workshop will demonstrate the use of analytics for real-life use cases. Power BI and Marketing Data.
While data science is unquestionably a fantastic career path regarding the impressive ratings and the fact that it is such an in-demand job, statistics show that there will be no slowing down for the surprisingly rapid increase for the demand of data scientists around the globe. This company is great for businessanalytics.
More people are online today than ever before, so online tracking is inevitably used to obtain statistics and data for websites. Analyzing these statistics will help teams decide what needs to be addressed or what is working well for the site. Closing Thoughts.
This article provides a brief explanation of the SVM Classification method of analytics. SVM Classification Analysis can be used for many analytical tasks: Credit/Loan Approval Analysis – Given a list of client transactional attributes, a business can predict whether a client will default on a loan. Use Case – 1.
After a hiatus of a few months, the latest version of the peterjamesthomas.com Data and Analytics Dictionary is now available. Embedded BI / Analytics. Statistics. Self-service (BI or Analytics). If you have found The Data & Analytics Dictionary helpful, we would love to learn more about this. Decision Model.
Smarten announces the recent certification of its Smarten Augmented Analytics Software product by CERT-IN. Contact the Smarten team for more information on Smarten Augmented Analytics solution. Original Post : Smarten Augmented Analytics Receives CERT-IN Certification for Its Products and Services! About Smarten.
As companies striving to embrace digital transformation and become data-driven, business intelligence and analytics skills and experience are essential to building a data-savvy team. However, if someone puts you on the spot, can you clearly tell the difference between business intelligence and analytics? Definition.
Business analysts are in high demand, with 24% of Fortune 500 companies currently hiring business analysts across a range of industries, including technology (27%), finance (13%), professional services (10%), and healthcare (5%), according to data from Zippia. Amazon, Capgemini, and IBM.
This article provides a brief explanation of the definition and uses of the Descriptive Statistics algorithms. What is a Descriptive Statistics? Descriptive statistics helps users to describe and understand the features of a specific dataset, by providing short summaries and a graphic depiction of the measured data.
Smarten has announced the launch of Predictive Model Mark-Up Language (PMML) Integration capability for its Smarten Augmented Analytics suite of products. Enjoy the Smarten feature set and seamless workflow to perform predictive analytics with support of REST-API for third-party apps for prediction.
As a result of the benefits of businessanalytics , the demand for Data analysts is growing quickly. The Bureau of Labor Statistics reports that the role of research and data analysts is projected to grow as much as 23% in the next 8 years. That is a staggering increase in comparison to most other industries.
As the concept of businessanalytics becomes more main stream and business users embrace the possibilities, they (and their managers) want and expect even more tools and more potential. Advanced Data Discovery allows business users to quickly and easily prepare and analyze data and visualize and explore data.
If your role in business demands that you stay abreast of changes in businessanalytics, you are probably familiar with the term Smart Data Discovery. You may also have read the recent Gartner report entitled, ‘Augmented Analytics Is the Future of Data and Analytics’ , Published 27 July 2017, by Rita L.
We organize all of the trending information in your field so you don't have to. Join 42,000+ users and stay up to date on the latest articles your peers are reading.
You know about us, now we want to get to know you!
Let's personalize your content
Let's get even more personalized
We recognize your account from another site in our network, please click 'Send Email' below to continue with verifying your account and setting a password.


Let's personalize your content