This site uses cookies to improve your experience. To help us insure we adhere to various privacy regulations, please select your country/region of residence. If you do not select a country, we will assume you are from the United States. Select your Cookie Settings or view our Privacy Policy and Terms of Use.
Cookie Settings
Cookies and similar technologies are used on this website for proper function of the website, for tracking performance analytics and for marketing purposes. We and some of our third-party providers may use cookie data for various purposes. Please review the cookie settings below and choose your preference.
Used for the proper function of the website
Used for monitoring website traffic and interactions
Cookie Settings
Cookies and similar technologies are used on this website for proper function of the website, for tracking performance analytics and for marketing purposes. We and some of our third-party providers may use cookie data for various purposes. Please review the cookie settings below and choose your preference.
Strictly Necessary: Used for the proper function of the website
Performance/Analytics: Used for monitoring website traffic and interactions
Introduction What’s the most important skill you need to succeed in the analytics domain? The post 9 Key Skills Every BusinessAnalytics Professional Should Have appeared first on Analytics Vidhya. I’ve seen this question floating around everywhere – our discussion.
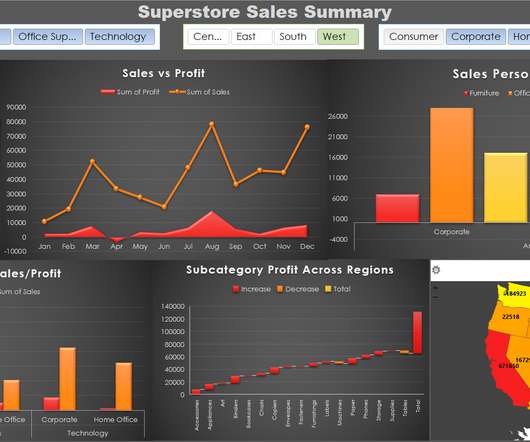
Overview Excel charts are a powerful way to showcase your analytics profile Here are three ambitious Excel charts every analyst should be familiar with. The post 3 Ambitious Excel Charts to Boost your Analytics and Visualization Portfolio appeared first on Analytics Vidhya.
Overview In this article, we will be dealing with Walmart’s sales dataset and will follow all the data analysis steps on the same and as a result, will try to get some business-related insights from the operations we will be performing on this dataset. […].
Their business unit colleagues ask an endless stream of urgent questions that require analytic insights. Business analysts must rapidly deliver value and simultaneously manage fragile and error-prone analytics production pipelines. In businessanalytics, fire-fighting and stress are common.
The post Tableau Tip: Visualize a Single Value Against Others appeared first on Analytics Vidhya. Introduction How often have we all tried to compare a value against a range, with unsatisfying results? Excel is the most common tool for.
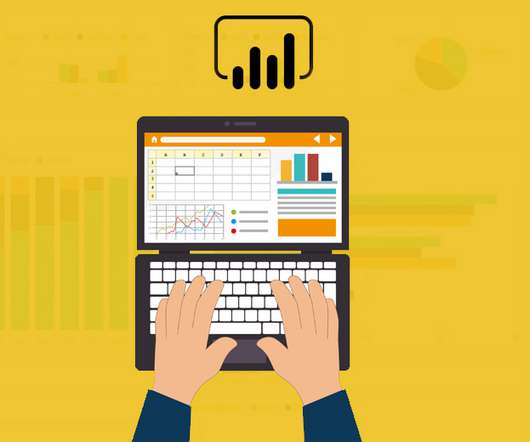
Microsoft‘s businessanalytics product, Power BI, delivers interactive data visualization BI capabilities that allow users to see and share data and insights throughout their organisation. Power BI provides insight data by using data interactively and exploring it by visualizations. […]. What is Power BI?
Overview Animated visualizations are a work of art and are really easy to create in Tableau We’ll work with open-source datasets here and create. The post Build your own Animated Data Visualization in Tableau in Just 5 Minutes appeared first on Analytics Vidhya.
Spreadsheets finally took a backseat to actionable and insightful data visualizations and interactive business dashboards. The rise of self-service analytics democratized the data product chain. Suddenly advanced analytics wasn’t just for the analysts. Share the essential business intelligence trends among your team!
With the growth of business data, it is no longer surprising that AI has penetrated data analytics and business insight tools. Business insight and data analytics landscape. Artificial intelligence and allied technologies make business insight tools and data analytics software more efficient.
For a business to be data-driven, a Company needs to be highly data-driven and focus highly on customer analytics. The post Top Customer Analytics Interview Questions appeared first on Analytics Vidhya. Information about customers can be collected from many sources. It […].
Overview Analytics and Business Intelligence provide comprehensible view of the company and derive actionable insights. We’ll discuss 6 top business intelligence tools that you. The post 6 Top Tools for Analytics and Business Intelligence in 2020 appeared first on Analytics Vidhya.
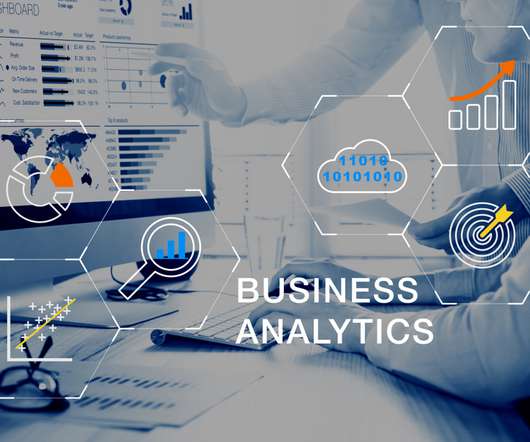
What is businessanalytics? Businessanalytics is the practical application of statistical analysis and technologies on business data to identify and anticipate trends and predict business outcomes. The discipline is a key facet of the business analyst role. Businessanalytics techniques.
1) What Is Business Intelligence And Analytics? 4) How Do BI And BA Apply To Business? If someone puts you on the spot, could you tell him/her what the difference between business intelligence and analytics is? We already saw earlier this year the benefits of Business Intelligence and BusinessAnalytics.
Analytics is becoming more important than ever in the world of business. Over 70% of global businesses use some form of analytics. For both reasons, the role of CIOs has to embrace automation and analytical thinking in strategizing the organization’s initiatives. is at the doorstep. and shall touch USD 65.4
The post 3 Advanced Excel Charts Every Analytics Professional Should Try appeared first on Analytics Vidhya. Overview Advanced Excel charts are a great way to create effective and impactful stories for our audience Learn 3 advanced Excel charts here to.
What’s the best Business Intelligence and Analytics tool in the market? A plethora of data science and business intelligence professionals and organizations have asked. Check out the latest developments in Best Analytics Tools appeared first on Analytics Vidhya.
In recent years, analytical reporting has evolved into one of the world’s most important business intelligence components, compelling companies to adapt their strategies based on powerful data-driven insights. What Is An Analytical Report? Your Chance: Want to build your own analytical reports completely free?
When completing a businessanalytics masters online, you will be taking a flexible course that works for you, letting you customize the degree to suit the industry you work in and allowing you to continue working alongside your studies. Here are just a few things to consider when thinking about a businessanalytics masters online.
Not just the leading technology giants in India but medium and small-scale companies are also betting on data science to revolutionize how business operations are performed. The post Top 10 Guest Authors on Analytics Vidhya in 2022 appeared first on Analytics Vidhya.
It’s hard to overestimate the value that data insights have come to represent to today’s businesses. Investments in analytics tech have risen commensurately, with some 73 percent of respondents telling IDC that they expect to spend more on data-focused software than any other category in 2023. Consolidating Information.
ArticleVideos Objective Tableau is the gold standard for BusinessAnalytics and Data Visualization tools in the industry Learn how to make a Rounded Bar. The post Tableau 101 – Create a Rounded Bar Chart and a Bar-in-Bar Chart in Tableau appeared first on Analytics Vidhya.
Introduction Power BI is a freely available tool from Microsoft for businessanalytics. It helps you visualize data and seamlessly share the insights from it with stakeholders. Whether you’re a data scientist, an analyst, or a business user, Power BI is a must-know tool that can make your work a lot easier.
Introduction Data visualization (DV) plays a crucial role in analyzing and interpreting data. With the growing importance of data science and machine learning, data analysis holds a special place in […] The post Creating Interactive and Animated Charts with ipyvizzu appeared first on Analytics Vidhya.
When encouraging these BI best practices what we are really doing is advocating for agile business intelligence and analytics. In our opinion, both terms, agile BI and agile analytics, are interchangeable and mean the same. Your Chance: Want to test an agile business intelligence solution? What Is Agile Analytics And BI?
What is data analytics? What tools help in data analytics? How can data analytics be applied to various industries? We will be answering all these […] The post What is Data Analytics? appeared first on Analytics Vidhya. How to Use it in Your Career?
The post The Art of Storytelling in Analytics and Data Science | How to Create Data Stories? appeared first on Analytics Vidhya. Introduction The idea of storytelling is fascinating; to take an idea or an incident, and turn it into a story. It brings the idea.
Overview Tableau vs. Qlik Sense – Each Analytics and Business Intelligence tool has its own distinct set of features We’ll compare Tableau and Qlik. The post Tableau vs. Qlik Sense – Which Analytics and Business Intelligence Tool Should you Use? appeared first on Analytics Vidhya.
Using business intelligence and analytics effectively is the crucial difference between companies that succeed and companies that fail in the modern environment. Your Chance: Want to try a professional BI analytics software? Experience the power of Business Intelligence with our 14-days free trial!
Explore the simple path to become a great visual data storyteller Are. The post A Quick Guide to Become a Data Analyst appeared first on Analytics Vidhya. This article was published as a part of the Data Science Blogathon.
BI projects aren’t just for the big fishes in the sea anymore; the technology has developed rapidly, the software has become more accessible while business intelligence and analytics projects implemented in various industries regularly, no matter the shape and size, small businesses or large enterprises.
3) The Link Between White Label BI & Embedded Analytics 4) An Embedded BI Workflow Example 5) White Labeled Embedded BI Examples In the modern world of business, data holds the key to success. That said, data and analytics are only valuable if you know how to use them to your advantage.
As such, we have to find approaches to data analytics and business intelligence. Not to forget, to squeeze the most value from your business’s most valuable data across touchpoints, it’s important to analyze it as it unfolds. Download our executive, pocket-sized guide to real time BI and analytics!
To put the power of business intelligence into perspective, here are 4 key insights you should know: Businesses using analytics are five times more likely to make better, quicker decisions, according to an article published on BetterBuys. By 2025, the global BI and analytics market is expected to soar to a worth of $147.19
What is data analytics? Data analytics is a discipline focused on extracting insights from data. The chief aim of data analytics is to apply statistical analysis and technologies on data to find trends and solve problems. What are the four types of data analytics?
This is where BusinessAnalytics (BA) and Business Intelligence (BI) come in: both provide methods and tools for handling and making sense of the data at your disposal. So…what is the difference between business intelligence and businessanalytics? What Does “BusinessAnalytics” Mean?
When you think of big data, you usually think of applications related to banking, healthcare analytics , or manufacturing. After all, these are some pretty massive industries with many examples of big data analytics, and the rise of business intelligence software is answering what data management needs. Behind the scenes.
Exclusive Bonus Content: Ready to use data analytics in your restaurant? In a previous study into big data examples in real life, we explored how the catering industry could benefit from the use of restaurants analytics – a topic that we’re going to delve deeper into here. What Are Restaurant Analytics?
Business reporting has been around for a long time but the tools and techniques of business intelligence have refined over time and now with the recent popularity of data driven business approach, data has been identified as the most valuable asset of a business and data analytics and reporting has finally found a key place in the business world.
We have written about management reporting methods that can be utilized in the modern practice of creating powerful analysis, bringing complex data into simple visuals, and employ them to make actionable decisions. Your Chance: Want to visualize & track operational metrics with ease? How To Select Operational Metrics And KPIs?
This gives to that sales graph an overall sense of visual contrast which makes it much more digestible at a glance. This most essential of sales graph templates offers a linear visualization of incremental sales success over time, coupled with a quick-glance snapshot of campaign revenue by channel. click to enlarge**.
As companies striving to embrace digital transformation and become data-driven, business intelligence and analytics skills and experience are essential to building a data-savvy team. However, if someone puts you on the spot, can you clearly tell the difference between business intelligence and analytics? Definition.
In the early days of analytics, only the largest companies could afford to leverage big data. All that’s changed and now there are accessible tools for businesses of all sizes. But which tools are the most effective for businesses in 2021? 5 Best Analytic Tools in 2021. Choosing an Analytics Tool. RapidMiner.
appeared first on Analytics Vidhya. In recent times, I have switched to learning Excel as it was a prerequisite in every company I had to apply to. I […]. The post How to Create Stunning and Interactive Dashboards in Excel?
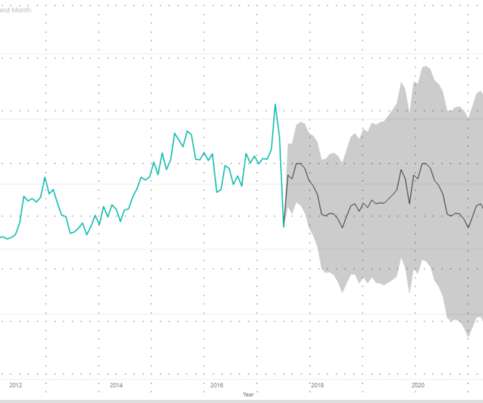
The post Time Series Forecasting using Microsoft Power BI appeared first on Analytics Vidhya. Introduction Time series forecasting is a really important area of Machine Learning as it gives you the ability to “see” ahead of time and.
We organize all of the trending information in your field so you don't have to. Join 42,000+ users and stay up to date on the latest articles your peers are reading.
You know about us, now we want to get to know you!
Let's personalize your content
Let's get even more personalized
We recognize your account from another site in our network, please click 'Send Email' below to continue with verifying your account and setting a password.


Let's personalize your content