This site uses cookies to improve your experience. To help us insure we adhere to various privacy regulations, please select your country/region of residence. If you do not select a country, we will assume you are from the United States. Select your Cookie Settings or view our Privacy Policy and Terms of Use.
Cookie Settings
Cookies and similar technologies are used on this website for proper function of the website, for tracking performance analytics and for marketing purposes. We and some of our third-party providers may use cookie data for various purposes. Please review the cookie settings below and choose your preference.
Used for the proper function of the website
Used for monitoring website traffic and interactions
Cookie Settings
Cookies and similar technologies are used on this website for proper function of the website, for tracking performance analytics and for marketing purposes. We and some of our third-party providers may use cookie data for various purposes. Please review the cookie settings below and choose your preference.
Strictly Necessary: Used for the proper function of the website
Performance/Analytics: Used for monitoring website traffic and interactions
Spreadsheets no longer provide adequate solutions for a serious company looking to accurately analyze and utilize all the business information gathered. That’s where businessintelligence reporting comes into play – and, indeed, is proving pivotal in empowering organizations to collect data effectively and transform insight into action.
Businessintelligence definition Businessintelligence (BI) is a set of strategies and technologies enterprises use to analyze business information and transform it into actionable insights that inform strategic and tactical business decisions.
CFO dashboards exist to enhance the strategic as well as the analytical efforts related to every financial aspect of your business. In essence, a CFO dashboard is the analytical nerve center for all of your most invaluable financial data. If a CFO KPI dashboard is the analytical framework, the reports are your analytical eyes.
One-time and complex queries are two common scenarios in enterprise data analytics. These complex queries typically involve data sources from multiple business systems, requiring multilevel nested SQL or associations with numerous tables for highly sophisticated analytical tasks.
Initially, data warehouses were the go-to solution for structured data and analytical workloads but were limited by proprietary storage formats and their inability to handle unstructured data. In practice, OTFs are used in a broad range of analytical workloads, from businessintelligence to machine learning.
Additionally, CRM dashboard tools provide access to insights that offer a concise snapshot of your customer-driven performance and activities through a range of features and functionalities empowered by online data visualization tools. One thing is clear: data-driven dashboard analytics is the path to consumer-driven success.
Whereas businessintelligence is tactical, financial intelligence is strategic. . As organizations have deployed an array of different systems to address their business requirements, the challenges of understanding that data have increased exponentially. Businessintelligence is tactical.
Objective Gupshup wanted to build a messaging analytics platform that provided: Build a platform to get detailed insights, data, and reports about WhatsApp/SMS campaigns and track the success of every text message sent by the end customers. Incremental analytics is the main reason for Gupshup to use Redshift.
This authority extends across realms such as businessintelligence, data engineering, and machine learning thus limiting the tools and capabilities that can be used. It’s widely used by developers, content creators, and businesses to streamline their media workflows, enhance user experiences, and optimize content delivery.
Table of Contents 1) Benefits Of Big Data In Logistics 2) 10 Big Data In Logistics Use Cases Big data is revolutionizing many fields of business, and logistics analytics is no exception. According to studies, 92% of data leaders say their businesses saw measurable value from their data and analytics investments.
An interactive dashboard is a data management tool that tracks, analyzes, monitors, and visually displays key business metrics while allowing users to interact with data, enabling them to make well-informed, data-driven, and healthy business decisions. They all host invaluable data for your business.
Smarten announces the launch of SnapShot Anomaly Monitoring Alerts for Smarten Augmented Analytics. SnapShot Monitoring provides powerful data analytical features that reveal trends and anomalies and allow the enterprise to map targets and adapt to changing markets with clear, prescribed actions for continuous improvement.
Today, tens of thousands of AWS customers—from Fortune 500 companies, startups, and everything in between—use Amazon Redshift to run mission-critical businessintelligence (BI) dashboards, analyze real-time streaming data, and run predictive analytics.
Doing so will not only help you to squeeze additional value from your organizational data, but it will also provide the opportunity to set performance targets and measure incremental success in vital areas of the business. To track KPIs is to gain greater businessintelligence. We offer a 14 day free trial.
A sales growth graph that will help make your business robust, adaptable, and of course—profitable. Number 6 on our list is a sales graph example that offers a detailed snapshot of sales conversion rates. that Increasing revenue in a sales-based business can come from several areas, broadly speaking. 6) Sales Conversion.
Management reporting is a source of businessintelligence that helps business leaders make more accurate, data-driven decisions. To answer these questions, you will need a financial management report, focused not on legal requirements, but business-level, and decision-making ones.
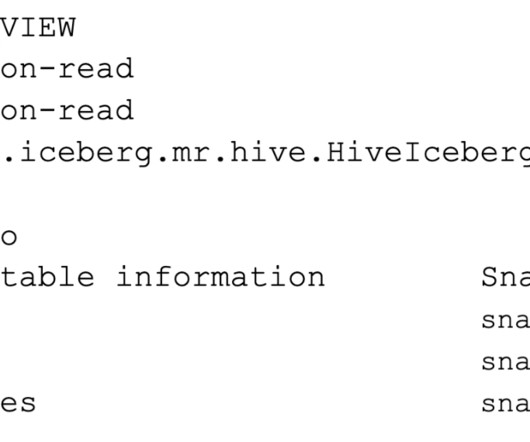
History management in data systems is fundamental for compliance, businessintelligence, data quality, and time-based analysis. Anytime when you need SCD Type-2 snapshot of your Iceberg table, you can create the corresponding representation. You can obtain the table snapshots by querying for db.table.snapshots.
Organizations with legacy, on-premises, near-real-time analytics solutions typically rely on self-managed relational databases as their data store for analytics workloads. Near-real-time streaming analytics captures the value of operational data and metrics to provide new insights to create business opportunities.
Storytelling through data is the process of transforming data-driven analyses into a widely-accessible visual format to influence a business decision, strategy, or action by utilizing analytical information that, ultimately, turn into actionable insights. As you’re no doubt aware—in business, time is money.
One key component that plays a central role in modern data architectures is the data lake, which allows organizations to store and analyze large amounts of data in a cost-effective manner and run advanced analytics and machine learning (ML) at scale. Moreover, running advanced analytics and ML on disparate data sources proved challenging.
All areas of your modern-day business – from supply chain success to improved reporting processes and communications, interdepartmental collaboration, and general organization innovation – can benefit significantly from the use of analytics, structured into a live dashboard that can improve your data management efforts. Interactivity.
When analytics and dashboards are inaccurate, business leaders may not be able to solve problems and pursue opportunities. If you have been in the data profession for any length of time, you probably know what it means to face a mob of stakeholders who are angry about inaccurate or late analytics.
When data is used to improve customer experiences and drive innovation, it can lead to business growth,” – Swami Sivasubramanian , VP of Database, Analytics, and Machine Learning at AWS in With a zero-ETL approach, AWS is helping builders realize near-real-time analytics. Ongoing changes will be synced in near real time.
What are white-labeled reports White-label reports: Under the hood Exploring white-label dashboards Use case snapshots Horsepower under the hood. Every company is working toward harnessing data and analytics in its own way in order to stay relevant in a changing business world. Every company is becoming a data company.
It supports modern analytical data lake operations such as create table as select (CTAS), upsert and merge, and time travel queries. Athena also supports the ability to create views and perform VACUUM (snapshot expiration) on Apache Iceberg tables to optimize storage and performance.
Tens of thousands of customers use Amazon Redshift to process exabytes of data every day to power their analytics workloads. Configure Amazon Redshift Data Warehouse Create a snapshot following the guidance in the Amazon Redshift Management Guide. Launch the producer warehouse by restoring the snapshot to a 32 RPU serverless namespace.
You can store your data as-is, without having to first structure the data and then run different types of analytics for better business insights. Analytics use cases on data lakes are always evolving. This can be checked using.snapshots to check Iceberg tables’ snapshot file location. target_iceberg_add_files/metadata/.
The next in our rundown of dynamic business reports examples comes in the form of our specialized SaaS metrics dashboard. With visual KPIs that include customer acquisition costs, customer lifetime value, MMR, and APRU, here, you will find everything you need to streamline your business’s initiatives at a glance. click to enlarge**.
Amazon Redshift is a fast, fully managed, petabyte-scale data warehouse that provides the flexibility to use provisioned or serverless compute for your analytical workloads. Modern analytics is much wider than SQL-based data warehousing. Solution overview AWS SCT uses a service account to connect to your Azure Synapse Analytics.
Smarten is pleased to announce that its Smarten Augmented Analytics solution is included as a Representative Vendor in the Market Guide for Augmented Analytics Published October 2, 2023 (ID G00780764).
The new capabilities, which include incremental feature additions to its Text Enhance offering and two new connectors for its analytics warehouse and point of sale (POS) offerings, were announced on Thursday at the company’s SuiteConnect event in New York. The company has not said when the updates to Text Enhance will become available.
Add Integrated Analytics to Tally Prime and Tally ERP to Add Value to Your Organization! Adding to the value of the modules and features of these Tally offerings, is the ability to integrate businessintelligence and augmented analytics within the Tally environment. The mobile app is suitable for Android and iOS.
Using an IT analytics software is extremely useful in the matter: by gathering all your data in a single point-of-truth, you can easily analyze everything at once and create actionable IT dashboards. Communicate your findings and see what they have analyzed and dug out from the analytics. “ Everything is designed.
A procurement report allows an organization to demonstrate how its procurement activities deliver value for money, contribute to the realization of its broader goals and objectives, and provide a panoramic snapshot of the effectiveness of its procurement strategy. b) Minimize errors throughout the supplier chain.
Integrate Analytics with Tally ERP for Mobile, Desktop, Complex and Simple Data Analysis! If your business is currently using Tally ERP for its accounting, finance, inventory, purchasing, sales and other requirements, there is a way you can take your business users to the next level with analytics.
Apache Iceberg is a high-performance open table format for petabyte-scale analytic datasets. Materialized views are valuable for accelerating common classes of businessintelligence (BI) queries that consist of joins, group-bys and aggregate functions. If any of the source tables were compacted since the last rebuild.
In the following sections, we discuss the most common areas of consideration that are critical for Data Vault implementations at scale: data protection, performance and elasticity, analytical functionality, cost and resource management, availability, and scalability. Manual snapshots can be kept indefinitely at standard Amazon S3 rates.
Augmented Analytics Takes Tally ERP Beyond Data Entry and Reporting! In this article, we discuss important, flexible augmented analytics tools for Tally ERP. Use mobile access for quick snapshots, to track and monitor and check results and transactions while you are on the road. Let’s talk numbers!
Without big data analytics, companies are blind and deaf, wandering out onto the Web like deer on a freeway. Download our guide to boost your business efforts and jump to success! Companies that use data analytics are five times more likely to make faster decisions, based on a survey conducted by Bain & Company.
A static report offers a snapshot of trends, data, and information over a predetermined period to provide insight and serve as a decision-making guide. Return Reason. “Data is what you need to do analytics. Information is what you need to do business.” What Is Static Reporting? Primary KPIs: Total Orders.
With Iceberg in CDP, you can benefit from the following key features: CDE and CDW support Apache Iceberg: Run queries in CDE and CDW following Spark ETL and Impala businessintelligence patterns, respectively. We see that as of the first snapshot ( 7445571238522489274) we had data from the years 1995 to 2005 in the table.
Simply put, you can understand the report as a snapshot of the actual situation, and the analysis can be described as the further exploration of the phenomenon. If you want to know in more details, you can refer to: Reporting vs Analytics: Why Different & Which is More Needed? Informational or Analytical. Periodic Reports.
Answer : Along with standard RDS features, Amazon RDS for Db2 supports key Db2 features, such as row and column organized tables for mixed and analytic workloads, the Adaptive Workload Optimizer to for better resource management, and rules-based access controls for advanced data protection. Scalability 5.
This data is then projected into analytics services such as data warehouses, search systems, stream processors, query editors, notebooks, and machine learning (ML) models through direct access, real-time, and batch workflows.
We organize all of the trending information in your field so you don't have to. Join 42,000+ users and stay up to date on the latest articles your peers are reading.
You know about us, now we want to get to know you!
Let's personalize your content
Let's get even more personalized
We recognize your account from another site in our network, please click 'Send Email' below to continue with verifying your account and setting a password.


Let's personalize your content