This site uses cookies to improve your experience. To help us insure we adhere to various privacy regulations, please select your country/region of residence. If you do not select a country, we will assume you are from the United States. Select your Cookie Settings or view our Privacy Policy and Terms of Use.
Cookie Settings
Cookies and similar technologies are used on this website for proper function of the website, for tracking performance analytics and for marketing purposes. We and some of our third-party providers may use cookie data for various purposes. Please review the cookie settings below and choose your preference.
Used for the proper function of the website
Used for monitoring website traffic and interactions
Cookie Settings
Cookies and similar technologies are used on this website for proper function of the website, for tracking performance analytics and for marketing purposes. We and some of our third-party providers may use cookie data for various purposes. Please review the cookie settings below and choose your preference.
Strictly Necessary: Used for the proper function of the website
Performance/Analytics: Used for monitoring website traffic and interactions
2) Benefits Of White Label Reports 3) Key White Label Reporting Features 4) White Label Dashboards & Report Examples In today’s competitive business environment, building a brand that is trusted, recognizable, and loved by many is not an easy task. These analysis tools are not only customized in appearance but also in functionality.
Developing analytic apps is a bold new direction for product teams. The Toolbox is where we talk development best practices, tips, tricks, and success stories to help you build the future of analytics and empower your users with the insights and actions they need. If you’re building actionable analytics, this is also the case.
I recently saw an informal online survey that asked users what types of data (tabular; text; images; or “other”) are being used in their organization’s analytics applications. The results showed that (among those surveyed) approximately 90% of enterprise analytics applications are being built on tabular data.
The Sisense data and analytics platform already gives you unparalleled flexibility when it comes to what you can do with your data as you embed insights into your product. Now, enhanced integration with two heavy-hitter Adobe Creative Cloud programs, XD and Photoshop, takes your ability to create and deploy custom visuals to new heights.
Deal brings operational reporting to insightsoftware’s 25,000+ customers and provides fuel for growth to Logi Analytics’s embedded analytics for commercial software organizations. Headquartered in McLean, VA, Logi Analytics serves customers around the world with teams located in Ireland, England, China, and Ukraine.
This intermediate layer strikes a balance by refining data enough to be useful for general analytics and reporting while still retaining flexibility for further transformations in the Gold layer. At the same time, the Gold layer’s “single version of the truth” makes data accessible and reliable for reporting and analytics.
The synthesis of AI and analytics will have profound effects on every company that uses data in its mission. It will become the water we all swim in, helping reduce decision fatigue and giving humans the benefits of immense data stores without hours spent in front of dashboards. Users care about end results, not companies or software.
It can refer to predictive analytics or even “big data.” It will also provide insight into the many different types of reports that you can create with analytics software. A dashboard is a customizedanalytical tool that provides an overview of crucial information about a particular function or process in real-time.
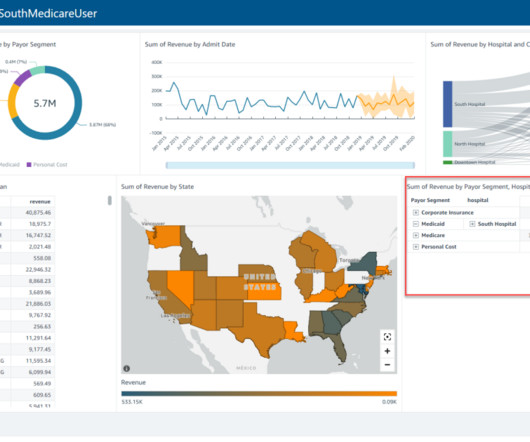
Amazon QuickSight is a fully managed, cloud-native business intelligence (BI) service that makes it easy to connect to your data, create interactive dashboards, and share these with tens of thousands of users, both within QuickSight and embedded in your software as a service (SaaS) applications. Add the OR condition to RLS tags.
Savvy companies are infusing actionable intelligence into every workflow, process, and business application, making it simpler than ever for any team to use analytics effectively and be truly data driven. Read on to see how infused analytics boosts the effectiveness of CS teams and contributes to business growth. Discover why.
Prescriptive Analytics. Automation & Augmented Analytics. Augmented analytics uses artificial intelligence to process data and prepare insights based on them. Unique feature: custom visualizations to fit your business needs better. Unique feature: custom visualizations to fit your business needs better.
After we had established what capabilities we needed to close our analytics gap, we got in touch with the Amazon QuickSight team to help. We had the data necessary to tell that ROI story, but we needed an analytics solution that would allow us to provide insights that can be communicated to leadership.
According to Gartner, although the number of employees that use analytics and business intelligence (ABI) has increased in 87% of surveyed organizations, ABI is still used by only 29% of employees on average. Dashboards are static and require users to come with specific queries or metrics in mind.
In this article, we’ll explore three ways you can build a more personalized analytics experience for your customers and end users. The right data visualization will take your customanalytics to the next level. Defining personalization — a key to analytics success. Explore data vis libraries.
This becomes even more critical when integrating third-party software, like embedded analytics, into your application. Sisense Themes takes the Sisense UI Customization capability further by enabling you to personalize how users experience Sisense at a more granular level, so you can create truly customanalytics.
Tools of the Trade is your destination for data and analytics skill building: From dashboards and reports to embedding analytics and building customanalytic apps to SQL secrets and data deep-dives, whatever you need to know to be better at your job, you can find it here. Three steps to actionable analytics.
Every company is becoming a data company, and the ability to harness data and analytics separates industry leaders from the rest of the pack. Customers are demanding actionable intelligence in the applications, products, and services they use daily, and companies of all kinds are scrambling to give it to them. What is embedded BI?
This is my second year attending Gartner’s Data and Analytics Summit and I love it. I love it because the conversations I have with analytics leaders about social analytics shed brilliant light on why social analytics has been, and often continues to be, the responsibility of a separate social marketing team.
Tools of the Trade is your destination for data and analytics skill building: From dashboards and reports to embedding analytics and building customanalytic apps to SQL secrets and data deep-dives, whatever you need to know to be better at your job, you can find it here. But what makes or breaks a dashboard?
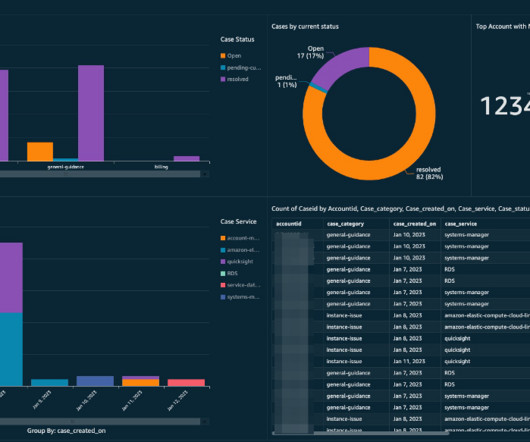
This post describes how Amazon QuickSight dashboards can help you visualize your support cases in a single pane of glass using data extracts from Systems Manager. QuickSight meets varying analytic needs from the same source of truth through modern interactive dashboards, paginated reports, embedded analytics, and natural language queries.
Learn more from guest blogger Ikechi Okoronkwo, Executive Director, Business Intelligence & Advanced Analytics at Mindshare. As a global media agency network that delivers value in different ways (media investment management, planning and buying, content, creative, strategy, analytics, etc.), Download Now.
Tools of the Trade is your destination for data and analytics skill building: From dashboards and reports to embedding analytics and building customanalytic apps to SQL secrets and data deep-dives, whatever you need to know to be better at your job, you can find it here. Laying the foundation with data.
In today’s data-driven landscape, businesses are constantly seeking innovative solutions to harness the power of analytics effectively. Embedded BI tools have emerged as a transformative force, seamlessly integrating analytical capabilities directly into existing software applications.
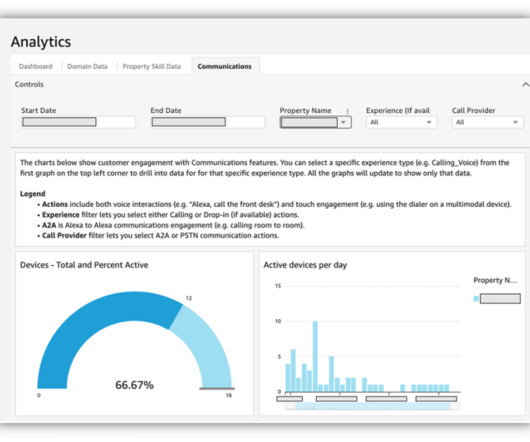
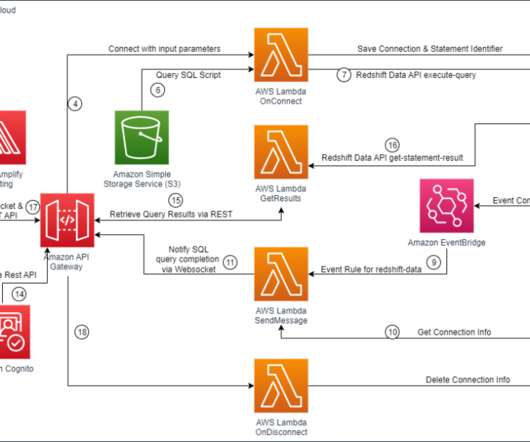
Serverless applications are a modernized way to perform analytics among business departments and engineering teams. Use cases can include the following: Dashboarding – A webpage consisting of tables and charts where each component can offer insights to a specific business department. What are WebSockets and why do we need them?
In Gartner’s Top 10 Data and Analytics Trends for 2021, trend No. 9 is “dashboards will be replaced with automated, conversational, mobile, and dynamically generated insights customized to a user’s needs and delivered to their point of consumption.” Rapid, code-free customization with Sisense Themes.
A routine set of specific analytical tasks (Analyzing the data in the same specific ways again and again). Dashboard development (Developing displays that others can use to rapidly monitor performance). Presentation preparation (Preparing displays of data that will be presented in meetings or in custom reports).
In this post, we discuss how you can use purpose-built AWS services to create an end-to-end data strategy for C360 to unify and govern customer data that address these challenges. As you mature in each of these pillars, you progress towards responding to real-time customer signals.
Raleigh, N.C – August 4, 2022 – insightsoftware , a global provider of reporting, analytics, and performance management solutions, today announced the release of Logi Composer 7. Developers maintain complete control over the analytics experience while also empowering end users to securely explore, analyze, and share data.
Rapid technological advancements and extensive networking have propelled the evolution of data analytics, fundamentally reshaping decision-making practices across various sectors. These professionals collaborate with IT teams, management, or data scientists to align analytical efforts with organizational objectives across various industries.
According to research by data analytics firm Exasol, 87% of U.S. Putting the right piece of actionable intelligence in front of the right person at the right time leads to better decision-making that increases sales conversion, revenue, and customer satisfaction. These capabilities are enabled by AI analytics.”.
Data and analytics are proving more important to companies’ strategies than ever before, according to a survey by Harvard Business Review Analytic Services. However, many organizations still fall short of achieving their analytics goals, owing to a skills gap and issues with data access and usage.
Nose to the grind "How do I" questions: David Walizer: How do you sell the value of web analytics to a skeptical client in 30 seconds or less? By doing multichannel analytics! More detail on those techniques, and three more, are in this blog post: Multichannel Analytics: Tracking Offline Conversions. Let's go!
Introduction Why should I read the definitive guide to embedded analytics? But many companies fail to achieve this goal because they struggle to provide the reporting and analytics users have come to expect. The Definitive Guide to Embedded Analytics is designed to answer any and all questions you have about the topic.
But without strong analytics, you may be leaving ROI on the table. Until now, embedding analytics features has been an afterthought, a luxury thats hard to justify for your application. They are the spearhead of your application, driving its influence within your customers’ organizations.
With this new unlocked potential, advanced analytics jumped back to the top of the capability wish list for many technology buyers. With customers now expecting more than ever from analytics, many development teams invested in embedded analytics solutions to reduce the workload and time to value for their applications.
Pressure for on-demand data insights is increasing as potential buyers look for intuitive, but deep analytics functionality to help navigate their business through these uncertain economic times. Customizable Dashboards for an Improved User Experience An engaging, beautiful dashboard is the key to every leader’s heart.
We organize all of the trending information in your field so you don't have to. Join 42,000+ users and stay up to date on the latest articles your peers are reading.
You know about us, now we want to get to know you!
Let's personalize your content
Let's get even more personalized
We recognize your account from another site in our network, please click 'Send Email' below to continue with verifying your account and setting a password.


Let's personalize your content