This site uses cookies to improve your experience. To help us insure we adhere to various privacy regulations, please select your country/region of residence. If you do not select a country, we will assume you are from the United States. Select your Cookie Settings or view our Privacy Policy and Terms of Use.
Cookie Settings
Cookies and similar technologies are used on this website for proper function of the website, for tracking performance analytics and for marketing purposes. We and some of our third-party providers may use cookie data for various purposes. Please review the cookie settings below and choose your preference.
Used for the proper function of the website
Used for monitoring website traffic and interactions
Cookie Settings
Cookies and similar technologies are used on this website for proper function of the website, for tracking performance analytics and for marketing purposes. We and some of our third-party providers may use cookie data for various purposes. Please review the cookie settings below and choose your preference.
Strictly Necessary: Used for the proper function of the website
Performance/Analytics: Used for monitoring website traffic and interactions
Without big data analytics, companies are blind and deaf, wandering out onto the Web like deer on a freeway. Exclusive Bonus Content: Executive Dashboards & Reports: A Summary. Companies that use data analytics are five times more likely to make faster decisions, based on a survey conducted by Bain & Company.
In our data storytelling workshops, I like to discuss the emerging role of ‘analytics translators.’ Analytics Translators need to take an active role in finding, shaping, and conveying the message. It isn't good enough to create a lot of dashboards and reports if no one in your organization is using them.
Join the AWS Analytics team at AWS re:Invent this year, where new ideas and exciting innovations come together. For those in the data world, this post provides a curated guide for all analytics sessions that you can use to quickly schedule and build your itinerary. Book your spot early for the sessions you do not want to miss.
In our workshops on data storytelling, dashboard design, and data visualization, we are always emphasing the need to simplify. Instead of staring dejectedly into that mess of a closet, shift your gaze to that dashboard or report that you know needs some tough love. That’s right: it is time to fix that dashboard.
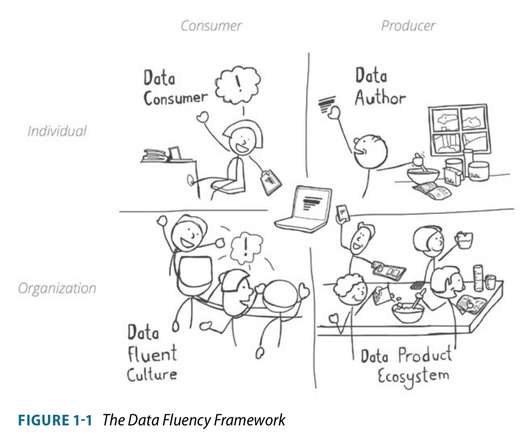
With our book , resources and workshops, we’ve shared guidance about what it takes to become a data fluent organization. Matt Lerner in conjunction with Business of Software delivers online workshops that help you determine your “North Star Metric” and the set of key drivers that are bottlenecks to achieving that overall success.
Online Analytical Processing (OLAP) is crucial in modern data-driven apps, acting as an abstraction layer connecting raw data to users for efficient analysis. The scope of data analytics has grown, and more user personas are now seeking to extract insights themselves. You can use Amazon Managed Service for Apache Flink service.
A recent article from the MIT Sloan Review (authored in part by Thomas ‘Competing on Analytics’ Davenport) summarizes survey results showing that many organizations lack an adequate data culture. At Juice, we’ve been saying for over a decade that analytics is a social problem, not a technology problem. Executive support.
I conducted a workshop in Florida recently, aimed at helping people to move from Business Intelligence to Analytics. These are general principles, and I hope it’s useful to people who produce business intelligence dashboards in these areas. Introduction to Microsoft Data Platform Analytics. You know who you are!
Alongside their partner AWS, they participated in AWS Data-Driven Everything (D2E) workshops and a bespoke AWS Immersion Day workshop that catered to their needs to improve their engagement with their customers. Data quality for account and customer data – Altron wanted to enable data quality and data governance best practices.
Is a dashboard a data story? A dashboard is about providing visibility to monitor data. 8 Best Data Storytelling Workshops ? Is a data visualization a data story? Not in and of itself. A data visualization can be a short data story if it has a specific message and exhibits features of storytelling. Generally not.
OpenSearch Serverless makes it simple to run petabyte-scale search and analytics workloads without having to configure, manage, or scale OpenSearch clusters. Kinesis Data Firehose is a popular service that delivers streaming data from over 20 AWS services to over 15 analytical and observability tools such as OpenSearch Serverless.
In response to this increasing need for data analytics, business intelligence software has flooded the market. Clean data in, clean analytics out. With all this information in hand, you can think about training opportunities such as workshops, seminars, and others. Let’s see this with an example of a sales dashboard.
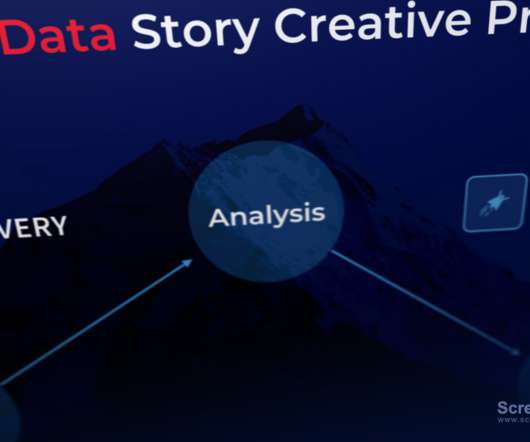
The answer is The Data Story Creative Process (DSCP) workshop — a hands-on, case study-based learning event that teaches a framework for using data to drive informed action. We learned a lot from our workshop. Our workshop discussion underscored our belief that data is a team sport. Sorry, no punchline…this is serious.
The primary challenge businesses face with near-real-time analytics is getting the data prepared for analytics in a timely manner, which can often take days. The consequence of delays in your organization’s analytics workflow can be costly. The following diagram illustrates the solution architecture.
To create a truly data-driven customer service analytics initiative, you must be empowered to mashup data from CRM, marketing, and financial sources to accurately track the full customer lifecycle—and make decisions about the future of your CS department based on data. Because not all churned customers should be mourned.
KPI dashboard releases you from your worries and troubles. What is a KPI dashboard? Definition of KPI dashboard. KPI dashboard uses interactive charts and data visualization to gather all your KPIs on one dashboard for easy viewing, comparison and analysis. Reality Use of KPI Dashboard.
No need to be worried anymore, all these management problems could be settled with digital dashboard. Digital dashboard: definition & benefits. Digital dashboard is one of the forms of applying business intelligence in reality. Workshop application of FineReport’s digital dashboard. Digital dashboard software.
Organizations are now turning to digital innovations such as AI-infused analytics platforms to enhance and grow the knowledge of their teams and talent. An AI-infused analytics platform like Sisense helps businesses understand the value that learning/training is providing in the workplace.
I had the responsibility of building the new analytics deployment from the ground up and scaling it to the mature and robust business intelligence solution that sets CTSI-Global apart today. With Sisense, we provide white-labeled embedded analytics within our client SaaS applications. Data Complexity. Automation and Integration.
Business dashboard: definition & benefits. What is a business dashboard? Business dashboards dig information from data and present an easily digestible view of business performance to help strategic and decision-making. Cartoon sketch of business dashboard. Benefits of business dashboard. Stick to visibility.
Or maybe you don’t have the time to attend a world-class data storytelling workshop ? Move beyond individual visualizations and dashboards A good visualization may set the scene for your data story or be the heart of your insights — but it seldom tells the full story. No problem. Part 2: Design Principles for Data Stories.
Better yet, implement a team KPI dashboard that will show you immediately how your team is performing and where do you need to allocate more resources ( educational materials or workshops ) so that the whole department has more chance to improve their results. Choose your KPIs carefully. Customer service team report.
By now you probably already know that data and analytics are a must-have for every and all parts of an organization. However, in order to make a strategic impact, HR teams need the right data and analytics platform that is easy to use and performs extremely well on large amounts and many sources of data. Q: Let’s start high-level.
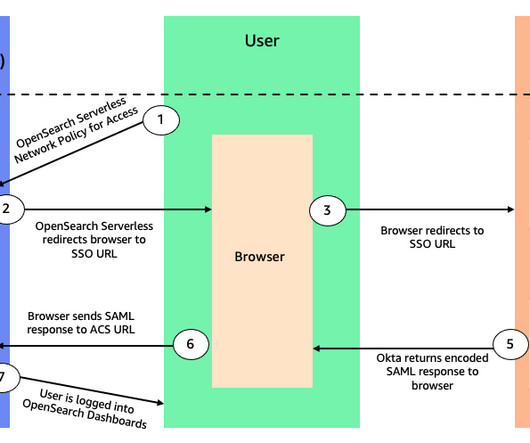
Amazon OpenSearch Serverless is a serverless option of Amazon OpenSearch Service that makes it easy for you to run large-scale search and analytics workloads without having to configure, manage, or scale OpenSearch clusters. OpenSearch Serverless validates the SAML assertion, and the user logs in to OpenSearch Dashboards. application.
OpenSearch is an open-source search and analytics suite that enables you to ingest, store, analyze, and visualize full text and log data. When you navigate to OpenSearch Dashboards, the workflow steps are as follows: OpenSearch Serverless generates a SAML authentication request. Create an Okta account , which you will use as an IdP.
I’m pleased to announce that I will be delivering a one day workshop as one of the two precons at SQL Saturday 382, Brisbane. Power Query 101 (for Power BI Dashboard). Creating Interactive Visualisation for Actionable Analytics. Publishing and Administering Dashboards and Reports in Power BI for the Organisation.
I’m pleased to announce that I will be delivering a one day workshop as one of the two precons at SQL Saturday 382, Brisbane. Power Query 101 (for Power BI Dashboard). Creating Interactive Visualisation for Actionable Analytics. Publishing and Administering Dashboards and Reports in Power BI for the Organisation.
Amazon OpenSearch Serverless provides the search and analytical functionality of OpenSearch without the manual overhead of configuring, managing, and scaling OpenSearch clusters. This policy only allows access to the collection’s OpenSearch endpoint through a VPC endpoint, but allows public access to the OpenSearch Dashboards endpoint.
The structure is the narrative flow that will grab a reader’s attention and carry them through the analytics to find valuable, actionable insights. We’ve been designing data stories, dashboards, and analytical tools for over a decade. But before James worries about all that, he starts by finding the structure of a story.
I’m pleased to announce that I will be delivering a one day workshop as one of the three precons at SQL Saturday 389, Huntington Beach, California. Power Query 101 (for Power BI Dashboard). Creating Interactive Visualisation for Actionable Analytics. Power Query 101 (For Power BI Dashboard).
I’m pleased to announce that I will be delivering a one day workshop as one of the three precons at SQL Saturday 389, Huntington Beach, California. Power Query 101 (for Power BI Dashboard). Creating Interactive Visualisation for Actionable Analytics. Power Query 101 (For Power BI Dashboard).
Kinesis Data Firehose is a popular service that delivers streaming data from over 20 AWS services such as AWS IoT Core and Amazon CloudWatch logs to over 15 analytical and observability tools such as Elastic. You can also customize and save your searches and place them on a dashboard. We simply find the source.ip
Moreover, it’s hard to right-size these settings for some use cases such as interactive analytics due to lack of visibility into future requirements. If not, refer to the Setting up Prometheus and Grafana for monitoring the cluster section of the Running batch workloads on Amazon EKS workshop to get them up and running on your cluster.
With managed domains, you can use advanced capabilities at no extra cost such as cross-cluster search, cross-cluster replication, anomaly detection, semantic search, security analytics, and more. At release, you could create search and time series collections for full-text search and log analytics use cases, respectively.
On investing in capabilities: We’ve set up something called a BI Center of Excellence where we train and have workshops and seminars on a monthly basis that team members across Novanta can join to learn about how they could leverage data marts or data sources to build their own reporting. Here are some edited excerpts of that conversation.
With Amazon MSK Replicator , you can build multi-Region resilient streaming applications to provide business continuity, share data with partners, aggregate data from multiple clusters for analytics, and serve global clients with reduced latency. For a hands-on experience, try out the Amazon MSK Replicator Workshop.
The time has come for data leaders to move beyond traditional governance and analytics sustainability is the next frontier for CDOs, and the opportunity to lead is now. Insufficient resource allocation for ESG data initiatives Managing sustainability data requires robust governance, analytics capabilities and cross-functional collaboration.
Once a quarter, they lead innovation workshops for each business unit, attended by IT people and process owners from that business. Many of these workshops focus on innovation opportunities from the manufacturing side of the business, and we’ve led one on the digital customer experience, which was across all the businesses.
Companies can use big data to better anticipate user needs and improve the user experience, automate updates, setup analytics systems to monitor traffic and test new landing pages more efficiently. Data analytics has made it easier to identify the best audience for your online business.
Today, we are happy to announce the general availability of Amazon OpenSearch Serverless , the serverless option for Amazon OpenSearch Service that makes it easier to run search and analytics workloads without even having to think about infrastructure management. What does simpler mean?
Data analytics on operational data at near-real time is becoming a common need. QuickSight lets you easily create and publish interactive BI dashboards that include ML-powered insights. QuickSight dashboards can be accessed from any device and seamlessly embedded into your applications, portals, and websites.
Amazon Redshift is the most widely used data warehouse in the cloud, best suited for analyzing exabytes of data and running complex analytical queries. Amazon QuickSight is a fast business analytics service to build visualizations, perform ad hoc analysis, and quickly get business insights from your data. The Datasets page opens.
There is usually a focus on the correct data, which may be a matter of ensuring which one of the many different data stores is selected that has the data as it may be duplicated across various sources and analytical systems. However, analytics is more complex than viewing a chart showing that sales costs have increased by five per cent.
The market for Enterprise BI & Analytics has reached a significant level of maturity, with platforms that offer robust core functionalities, such as reporting and dashboards, delivered with high quality. Today, differentiation among vendors increasingly hinges on specialized features and industry or department specific offerings.
We organize all of the trending information in your field so you don't have to. Join 42,000+ users and stay up to date on the latest articles your peers are reading.
You know about us, now we want to get to know you!
Let's personalize your content
Let's get even more personalized
We recognize your account from another site in our network, please click 'Send Email' below to continue with verifying your account and setting a password.


Let's personalize your content