This site uses cookies to improve your experience. To help us insure we adhere to various privacy regulations, please select your country/region of residence. If you do not select a country, we will assume you are from the United States. Select your Cookie Settings or view our Privacy Policy and Terms of Use.
Cookie Settings
Cookies and similar technologies are used on this website for proper function of the website, for tracking performance analytics and for marketing purposes. We and some of our third-party providers may use cookie data for various purposes. Please review the cookie settings below and choose your preference.
Used for the proper function of the website
Used for monitoring website traffic and interactions
Cookie Settings
Cookies and similar technologies are used on this website for proper function of the website, for tracking performance analytics and for marketing purposes. We and some of our third-party providers may use cookie data for various purposes. Please review the cookie settings below and choose your preference.
Strictly Necessary: Used for the proper function of the website
Performance/Analytics: Used for monitoring website traffic and interactions
Marketing invests heavily in multi-level campaigns, primarily driven by dataanalytics. This analytics function is so crucial to product success that the data team often reports directly into sales and marketing. As figure 2 summarizes, the data team ingests data from hundreds of internal and third-party sources.
Their business unit colleagues ask an endless stream of urgent questions that require analytic insights. Business analysts must rapidly deliver value and simultaneously manage fragile and error-prone analytics production pipelines. In business analytics, fire-fighting and stress are common. Analytics Hub and Spoke.
Beyond breaking down silos, modern data architectures need to provide interfaces that make it easy for users to consume data using tools fit for their jobs. Data must be able to freely move to and from datawarehouses, data lakes, and data marts, and interfaces must make it easy for users to consume that data.
In 2013, Amazon Web Services revolutionized the data warehousing industry by launching Amazon Redshift , the first fully-managed, petabyte-scale, enterprise-grade cloud datawarehouse. Amazon Redshift made it simple and cost-effective to efficiently analyze large volumes of data using existing business intelligence tools.
The requirement to integrate enormous quantities and varieties of data coupled with extreme pressure on analytics cycle time has driven the pharmaceutical industry to lead in DataOps adoption. The bottom line is how to attain analytic agility? It often takes months to progress from a data lake to the final delivery of insights.
Achieving this will also improve general public health through better and more timely interventions, identify health risks through predictive analytics, and accelerate the research and development process. You can send data from your streaming source to this resource for ingesting the data into a Redshift datawarehouse.
Organizations run millions of Apache Spark applications each month on AWS, moving, processing, and preparing data for analytics and machine learning. Data practitioners need to upgrade to the latest Spark releases to benefit from performance improvements, new features, bug fixes, and security enhancements.
Cloudera customers run some of the biggest data lakes on earth. These lakes power mission critical large scale dataanalytics, business intelligence (BI), and machine learning use cases, including enterprise datawarehouses. On datawarehouses and data lakes. Iterations of the lakehouse.
Cloudera customers run some of the biggest data lakes on earth. These lakes power mission critical large scale dataanalytics, business intelligence (BI), and machine learning use cases, including enterprise datawarehouses. On datawarehouses and data lakes. Iterations of the lakehouse.
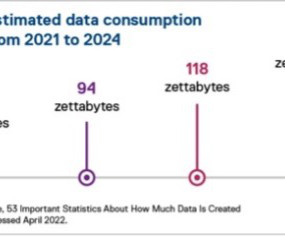
With the growing interconnectedness of people, companies and devices, we are now accumulating increasing amounts of data from a growing variety of channels. New data (or combinations of data) enable innovative use cases and assist in optimizing internal processes. Infographic of the key findings.
At IBM, we believe it is time to place the power of AI in the hands of all kinds of “AI builders” — from data scientists to developers to everyday users who have never written a single line of code. With watsonx.data , businesses can quickly connect to data, get trusted insights and reduce datawarehouse costs.
Once you’ve determined what part(s) of your business you’ll be innovating — the next step in a digital transformation strategy is using data to get there. Constructing A Digital Transformation Strategy: DataEnablement. Many organizations prioritize data collection as part of their digital transformation strategy.
In May 2021 at the CDO & Data Leaders Global Summit, DataKitchen sat down with the following data leaders to learn how to use DataOps to drive agility and business value. Kurt Zimmer, Head of Data Engineering for DataEnablement at AstraZeneca. Jim Tyo, Chief Data Officer, Invesco.
However, as dataenablement platform, LiveRamp, has noted, CIOs are well across these requirements, and are now increasingly in a position where they can start to focus on enablement for people like the CMO. The goal – at least in the initial instance – will be to reduce the siloing effect across organisations.
While growing dataenables companies to set baselines, benchmarks, and targets to keep moving ahead, it poses a question as to what actually causes it and what it means to your organization’s engineering team efficiency. What’s causing the data explosion? Can’t get to the data. However, there are ways to get around this.
The challenge comes when the data becomes huge and fast-changing. Why is quantitative data important? Quantitative data is often viewed as the bedrock of your business intelligence and analytics program because it can reveal valuable insights for your organization. Qualitative data benefits: Unlocking understanding.
Online analytical processing (OLAP) database systems and artificial intelligence (AI) complement each other and can help enhance data analysis and decision-making when used in tandem. Early OLAP systems were separate, specialized databases with unique data storage structures and query languages.
Streaming data facilitates the constant flow of diverse and up-to-date information, enhancing the models’ ability to adapt and generate more accurate, contextually relevant outputs. OpenSearch Service provides support for native ingestion from Kinesis data streams or MSK topics.
It was titled, The Gartner 2021 Leadership Vision for Data & Analytics Leaders. This was for the Chief Data Officer, or head of data and analytics. The fill report is here: Leadership Vision for 2021: Data and Analytics. Which industry, sector moves fast and successful with data-driven?
The data lake implemented by Ruparupa uses Amazon S3 as the storage platform, AWS Database Migration Service (AWS DMS) as the ingestion tool, AWS Glue as the ETL (extract, transform, and load) tool, and QuickSight for analytic dashboards. This long processing time reduced the analytic team’s productivity.
It’s a big week for us, as many Clouderans descend on New York for the Strata Data Conference. The week is typically filled with exciting announcements from Cloudera and many partners and others in the data management, machine learning and analytics industry. Technical Impact.
As a design concept, data fabric requires a combination of existing and emergent data management technologies beyond just metadata. Data fabric does not replace datawarehouses, data lakes, or data lakehouses.
After a blockbuster premiere at the Strata Data Conference in New York, the tour will take us to six different states and across the pond to London. After putting up a scintillating show at the Strata Data Conference in New York, Alation is touring Dreamforce in San Francisco. Data Catalogs Are the New Black.
This was an eventful year in the world of data and analytics. billion merger of Cloudera and Hortonworks, the widely scrutinized GDPR (General Data Protection Regulation), or the Cambridge Analytica scandal that rocked Facebook. Amid the headline grabbing news, 2018 will also be remembered as the year of the data catalog.
Patil also highlighted the need for pragmatic, data-driven leadership, saying “Every boardroom needs a Spock.” For those unfamiliar with Star Trek, Spock is known for his logical, analytical, and unemotional approach to making decisions – making him an ideal advisor in high-pressure situations. Cloud costs are growing prohibitive.
In Moving Parts , we explore the unique data and analytics challenges manufacturing companies face every day. The world of data in modern manufacturing. From a practical perspective, the computerization and automation of manufacturing hugely increase the data that companies acquire.
AI working on top of a data lakehouse, can help to quickly correlate passenger and security data, enabling real-time threat analysis and advanced threat detection. In order to move AI forward, we need to first build and fortify the foundational layer: data architecture.
A data pipeline is a series of processes that move raw data from one or more sources to one or more destinations, often transforming and processing the data along the way. Data pipelines support data science and business intelligence projects by providing data engineers with high-quality, consistent, and easily accessible data.
Technology that increases efficiency by simplifying reporting processes is important for finance teams to connect data, enable agility, and drive profitability. To see how insightsoftware solutions can help your organization achieve these goals, watch our video on driving business growth through automation.
By accessing and reporting on data near real-time, you can be confident that your decisions are based on consistent, reliable, and accurate information. Reporting with near real-time dataenables you to: Enjoy fast response times by refreshing reports against the latest Sage Intacct data and getting fast answers to your ad hoc inquiries.
This gives decision-makers access to current data for financial and operational reporting, reducing decision-making based on outdated information. Faster decision-making: Real-time dataenables faster decision-making, allowing organizations to respond quickly to ever-changing market conditions.
Not only is there more data to handle, but there’s also the need to dig deep into it for insights into markets, trends, inventories, and supply chains so that your organization can understand where it is today and where it will stand tomorrow. Interested in Business Analytics and Dashboards. Interested in Data Warehousing/BI Cubes.
Cloud-based solutions can automate tasks such as data collection, reconciliation, and reporting. Real-time Visibility and Insights : Cloud applications offer real-time access to financial data, enabling informed decision-making.
CXO seamlessly builds C-Level reports and dashboards against your Longview tax data, enabling you to present data in a more digestible format. Streamline your financial reporting process by reducing manual tasks and dedicating more time to analysis. Enhancing C-Level Reporting.
This eliminates multiple issues, such as wasted time spent on data manipulation and posting, risk of human error inherent in manual data handling, version control issues with disconnected spreadsheets, and the production of static financial reports.
A simple formula error or data entry mistake can lead to inaccuracies in the final budget that simply don’t reflect consensus. Connected dataenables rapid, effective, accurate collaboration among stakeholders throughout the organization. With the best planning and budgeting tools, everyone is operating on the same page.
Furthermore, EPM fosters improved collaboration and communication through shared data, enabling a more unified approach to financial management and disclosure preparation.
These Solutions Solve Today’s (and Tomorrow’s) Challenges Your team needs to move faster and smarter real-time, accurate, functional views of transactional dataenabling rapid decision-making.
We organize all of the trending information in your field so you don't have to. Join 42,000+ users and stay up to date on the latest articles your peers are reading.
You know about us, now we want to get to know you!
Let's personalize your content
Let's get even more personalized
We recognize your account from another site in our network, please click 'Send Email' below to continue with verifying your account and setting a password.


Let's personalize your content