This site uses cookies to improve your experience. To help us insure we adhere to various privacy regulations, please select your country/region of residence. If you do not select a country, we will assume you are from the United States. Select your Cookie Settings or view our Privacy Policy and Terms of Use.
Cookie Settings
Cookies and similar technologies are used on this website for proper function of the website, for tracking performance analytics and for marketing purposes. We and some of our third-party providers may use cookie data for various purposes. Please review the cookie settings below and choose your preference.
Used for the proper function of the website
Used for monitoring website traffic and interactions
Cookie Settings
Cookies and similar technologies are used on this website for proper function of the website, for tracking performance analytics and for marketing purposes. We and some of our third-party providers may use cookie data for various purposes. Please review the cookie settings below and choose your preference.
Strictly Necessary: Used for the proper function of the website
Performance/Analytics: Used for monitoring website traffic and interactions
In recent years, analytical reporting has evolved into one of the world’s most important business intelligence components, compelling companies to adapt their strategies based on powerful data-driven insights. What Is An Analytical Report? Your Chance: Want to build your own analytical reports completely free? Let’s get started.
Here, we’ll examine 18 essential KPIs for social media, explore the dynamics and demonstrate the importance of social metrics in the modern business age with the help of a KPI software , and, finally, wrapping up with tips on how to set KPIs and make the most of your social platforms. Let’s get going. What Are Social Media KPIs?
CFO dashboards exist to enhance the strategic as well as the analytical efforts related to every financial aspect of your business. In essence, a CFO dashboard is the analytical nerve center for all of your most invaluable financial data. If a CFO KPI dashboard is the analytical framework, the reports are your analytical eyes.
6) Data Quality Metrics Examples. quintillion bytes of data being produced on a daily basis and the wide range of online data analysis tools in the market, the use of data and analytics has never been more accessible. The data quality analysis metrics of complete and accurate data are imperative to this step. With a shocking 2.5
There is no golden metric for everyone, we are all unique snowflakes! :). and tell you what are the best key performance indicators (metrics) for them. In the past I’ve shared a cluster of metrics that small, medium and large businesses can use as a springboard…. If you want to play along. Don’t read what I’ve chosen.
When encouraging these BI best practices what we are really doing is advocating for agile business intelligence and analytics. In our opinion, both terms, agile BI and agile analytics, are interchangeable and mean the same. What Is Agile Analytics And BI? Agile Business Intelligence & Analytics Methodology.
Process Analytics. DataOps needs a directed graph-based workflow that contains all the data access, integration, model and visualization steps in the data analytic production process. Composable Analytics — A DataOps Enterprise Platform with built-in services for data orchestration, automation, and analytics.
Zero-ETL integration with Amazon Redshift reduces the need for custom pipelines, preserves resources for your transactional systems, and gives you access to powerful analytics. dbt Cloud is a hosted service that helps data teams productionize dbt deployments. For the purposes of this post, use a dbt Cloud-hosted managed repository.
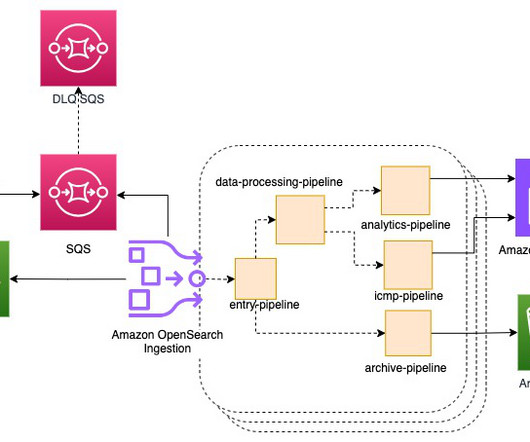
You can use this approach for a variety of use cases, from real-time log analytics to integrating application messaging data for real-time search. This allows the log analytics pipeline to meet Well-Architected best practices for resilience ( REL04-BP02 ) and cost ( COST09-BP02 ).
What CIOs can do: Avoid and reduce data debt by incorporating data governance and analytics responsibilities in agile data teams , implementing data observability , and developing data quality metrics. It also anonymizes all PII so the cloud-hosted chatbot cant be fed private information.
Read here how these metrics can drive your customers’ satisfaction up! Customer satisfaction metrics evaluate how the products or services supplied by a company meet or surpass a customer’s expectations. Exploring Customer Experience Analytics. Exclusive Bonus Content: Get our short guide to CES and NPS!
This post covers an important evolution in Google Analytics' segmentation power. You are going to love analytics and analysis so much more by the time you are done with this post! One of the key things we are going to learn today is to align our metrics and dimensions optimally to ensure we report good, clean, sensible data.
At its core, CRM dashboard software is a smart vessel for data analytics and business intelligence – digital innovation that hosts a wealth of insightful CRM reports. A dynamic CRM KPI dashboard or CRM report template will form the very foundations of your reporting and analytics initiatives. What Is A CRM Report?
The world of digital analytics seems to be insanely complicated. I led a discussion the other day with a collection of people who were brand new to the space and some who were jaded long-term residents of Camp Web Analytics. Digital Analytics Ecosystem: The Inputs. Digital Analytics Ecosystem: The Outputs. Averages this.
In Part 2 of this series, we discussed how to enable AWS Glue job observability metrics and integrate them with Grafana for real-time monitoring. In this post, we explore how to connect QuickSight to Amazon CloudWatch metrics and build graphs to uncover trends in AWS Glue job observability metrics.
It is also wise to clearly make a difference between data science and data analytics in a business context so that the exploration of the fields bring extra value for interested parties. Data science, also known as data-driven science, covers an incredibly broad spectrum. 3) “Advanced R” by Hadley Wickham. click for book source**.
End of a minor web analytics lesson on going beyond obvious metrics and never, ever, never forgetting context. Log into the Advanced Segmentation tool in your web analytics tool. If your web analytics tool requires you to call the vendor to set up advanced segments, or re-tag your site to get segments, then switch.
As the scale and complexity of microservices and distributed applications continues to expand, customers are seeking guidance for building cost-efficient infrastructure supporting operational analytics use cases. Operational analytics is a popular use case with Amazon OpenSearch Service. Choose Create pipeline.
Some examples are healthcare analytics software, retail analytics , or modern logistics analytics. Pre-defined metrics and KPIs: Vertical SaaS is already integrated with pre-defined metrics, KPIs , and analytics that businesses can utilize to assess and address daily and long-term processes and performance.
But there’s a host of new challenges when it comes to managing AI projects: more unknowns, non-deterministic outcomes, new infrastructures, new processes and new tools. Many consumer internet companies invest heavily in analytics infrastructure, instrumenting their online product experience to measure and improve user retention.
To help you understand the potential of analysis and how you can use it to enhance your business practices, we will answer a host of important analytical questions. This is one of the most important data analytics techniques as it will shape the very foundations of your success. Harvest your data.
We live in a data-driven age, and the ability to use financial insights and metrics to your advantage will set you apart from the pack. Our monthly reports are on top illustrated with beautiful data visualizations that provide a better understanding of the metrics tracked. The reporting tools to do that exist for that very purpose.
To put the power of business intelligence into perspective, here are 4 key insights you should know: Businesses using analytics are five times more likely to make better, quicker decisions, according to an article published on BetterBuys. By 2025, the global BI and analytics market is expected to soar to a worth of $147.19
3) The Link Between White Label BI & Embedded Analytics 4) An Embedded BI Workflow Example 5) White Labeled Embedded BI Examples In the modern world of business, data holds the key to success. That said, data and analytics are only valuable if you know how to use them to your advantage. What Is White Label Business Intelligence?
Quality test suites will enforce “equity,” like any other performance metric. As a result, enterprises will examine their end-to-end data operations and analytics creation workflows. The Great Resignation Hits Data & Analytics. Model developers will test for AI bias as part of their pre-deployment testing. Data Gets Meshier.
Moreover, a host of ad hoc analysis or reporting platforms boast integrated online data visualization tools to help enhance the data exploration process. By its very nature, the financial industry (or the financial departments) is rife with facts, figures, financial KPIs , metrics, and data.
Like many of today’s most important industries, digital data, metrics and KPIs (key performance indicators) are a part of a bright and prosperous future – and a comprehensive healthcare report has the power to deliver in each of these critical areas. This is a testament to the essential role of predictive analytics in the sector.
Moreover, within just five years, the number of smart connected devices in the world will amount to more than 22 billion – all of which will produce colossal sets of collectible, curatable, and analyzable data, claimed IoT Analytics in their industry report. What does this mean? 2) Select your KPIs. 3) Consider your data sources.
The ability to monitor, visualize, and analyze relevant data gives today’s businesses, across a host of sectors, the power to understand their prospects, make informed decisions, increase efficiencies, and work towards a set of rewarding long term goals. 2) Web Analytics Dashboard. Best Dashboard Ideas You Can Get Inspiration From.
Financial analytics can be kept under control with its numerous features that can remove complexities and establish a healthy and holistic overview of all the financial information a company manages. The balance sheet gives an overview of the main metrics which can easily define trends and the way company assets are being managed.
In essence, a project management dashboard is a data-driven platform that displays metrics, stats, and insights that are specific to a particular project or strategy by presenting a tailored mix of key performance indicators (KPIs) in one central location. Download right here our free guide and get started with dashboards! Centralized data.
Internally, making data accessible and fostering cross-departmental processing through advanced analytics and data science enhances information use and decision-making, leading to better resource allocation, reduced bottlenecks, and improved operational performance. Eliminate centralized bottlenecks and complex data pipelines.
By harnessing the insights, information, and metrics that are most valuable to key aspects of your business and understanding how to take meaningful actions from your data, you will ensure your business remains robust, resilient, and competitive. The Link Between Data And Business Performance.
Exclusive Bonus Content: Ready to use data analytics in your restaurant? In a previous study into big data examples in real life, we explored how the catering industry could benefit from the use of restaurants analytics – a topic that we’re going to delve deeper into here. What Are Restaurant Analytics?
Without big data analytics, companies are blind and deaf, wandering out onto the Web like deer on a freeway. Companies that use data analytics are five times more likely to make faster decisions, based on a survey conducted by Bain & Company. Geoffrey Moore, Author of Crossing the Chasm & Inside the Tornado.
Organizations with legacy, on-premises, near-real-time analytics solutions typically rely on self-managed relational databases as their data store for analytics workloads. Near-real-time streaming analytics captures the value of operational data and metrics to provide new insights to create business opportunities.
Developers, data architects and data engineers can initiate change at the grassroots level from integrating sustainability metrics into data models to ensuring ESG data integrity and fostering collaboration with sustainability teams. However, embedding ESG into an enterprise data strategy doesnt have to start as a C-suite directive.
Each Lucene index (and, therefore, each OpenSearch shard) represents a completely independent search and storage capability hosted on a single machine. To better highlight the performance, the following figures show metrics from the OpenSearch target cluster during this process (presented below).
Exclusive Bonus Content: Ready to make analytics straightforward? Online dashboards provide immediate navigable access to actionable analytics that has the power to boost your bottom line through continual commercial evolution. A data dashboard assists in 3 key business elements: strategy, planning, and analytics.
Here, we will consider the question ‘ What are operational reports,’ delve deeper into strategic reports, and examine a host of best operational reporting analysis practices. Real-time analytics serve up operational data in the moment. With this in mind, we are going to explore operational and strategic reporting. Let’s begin.
You can take all your data from various silos, aggregate that data in your data lake, and perform analytics and machine learning (ML) directly on top of that data. For a list of supported metrics, refer to Monitoring pipeline metrics. This data movement can be inside-out, outside-in, around the perimeter or sharing across.
Michael, politely, says in an email: "I have done web analytics for five years, I have mastered Omniture, WebTrends and Google Analytics, I provide analysis and not just reporting. I feel like am an Analytics God. Here's the Avinash Kaushik Web Analytics Career Introspection Guide ! Do some introspection.
Imagine you have a fleet of web servers logging performance metrics for each web request served into a Kinesis data stream with two shards and you used a request URL as the partition key. You can use the WriteProvisionedThrougputExceeded metric in Amazon CloudWatch in this case. and 120,000 as upper limits).
and metrics (follows, likes, reach, growth, awareness, post performance, engagements, etc.) Depending on the specific use-case and what kind of metrics you want to track, the reporting process for various social channels will be different. Choose the right metrics. What Is A Social Media Report? over various time frames.
We organize all of the trending information in your field so you don't have to. Join 42,000+ users and stay up to date on the latest articles your peers are reading.
You know about us, now we want to get to know you!
Let's personalize your content
Let's get even more personalized
We recognize your account from another site in our network, please click 'Send Email' below to continue with verifying your account and setting a password.


Let's personalize your content