This site uses cookies to improve your experience. To help us insure we adhere to various privacy regulations, please select your country/region of residence. If you do not select a country, we will assume you are from the United States. Select your Cookie Settings or view our Privacy Policy and Terms of Use.
Cookie Settings
Cookies and similar technologies are used on this website for proper function of the website, for tracking performance analytics and for marketing purposes. We and some of our third-party providers may use cookie data for various purposes. Please review the cookie settings below and choose your preference.
Used for the proper function of the website
Used for monitoring website traffic and interactions
Cookie Settings
Cookies and similar technologies are used on this website for proper function of the website, for tracking performance analytics and for marketing purposes. We and some of our third-party providers may use cookie data for various purposes. Please review the cookie settings below and choose your preference.
Strictly Necessary: Used for the proper function of the website
Performance/Analytics: Used for monitoring website traffic and interactions
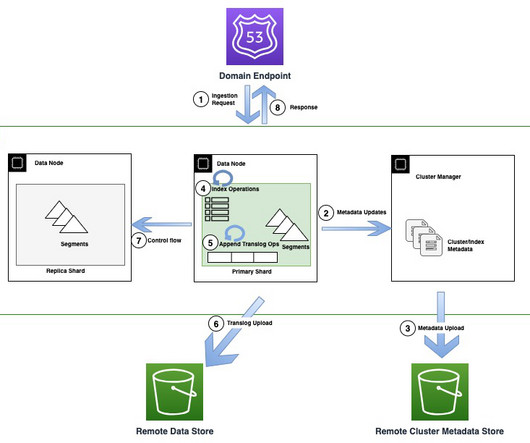
Snapshots are crucial for data backup and disaster recovery in Amazon OpenSearch Service. These snapshots allow you to generate backups of your domain indexes and cluster state at specific moments and save them in a reliable storage location such as Amazon Simple Storage Service (Amazon S3). Snapshots are not instantaneous.
In this post, we will introduce a new mechanism called Reindexing-from-Snapshot (RFS), and explain how it can address your concerns and simplify migrating to OpenSearch. Each Lucene index (and, therefore, each OpenSearch shard) represents a completely independent search and storage capability hosted on a single machine.
OpenSearch is a distributed search and analytics engine, which is an open-source project. OpenSearch Service seamlessly integrates with other AWS offerings, providing a robust solution for building scalable and resilient search and analytics applications in the cloud.
in Amazon OpenSearch Service , we introduced Snapshot Management , which automates the process of taking snapshots of your domain. Snapshot Management helps you create point-in-time backups of your domain using OpenSearch Dashboards, including both data and configuration settings (for visualizations and dashboards).
CFO dashboards exist to enhance the strategic as well as the analytical efforts related to every financial aspect of your business. In essence, a CFO dashboard is the analytical nerve center for all of your most invaluable financial data. If a CFO KPI dashboard is the analytical framework, the reports are your analytical eyes.
Additionally, CRM dashboard tools provide access to insights that offer a concise snapshot of your customer-driven performance and activities through a range of features and functionalities empowered by online data visualization tools. One thing is clear: data-driven dashboard analytics is the path to consumer-driven success.
As we enter into a new month, the Cloudera team is getting ready to head off to the Gartner Data & Analytics Summit in Orlando, Florida for one of the most important events of the year for Chief Data Analytics Officers (CDAOs) and the field of data and analytics.
With built-in features such as automated snapshots and cross-Region replication, you can enhance your disaster resilience with Amazon Redshift. Amazon Redshift supports two kinds of snapshots: automatic and manual, which can be used to recover data. Snapshots are point-in-time backups of the Redshift data warehouse.
Amazon Redshift is a cloud data warehousing service that provides high-performance analytical processing based on a massively parallel processing (MPP) architecture. Snapshots – These implements type-2 slowly changing dimensions (SCDs) over mutable source tables. The table refresh can be full or incremental based on the configuration.
Recently, we announced enhanced multi-function analytics support in Cloudera Data Platform (CDP) with Apache Iceberg. Iceberg is a high-performance open table format for huge analytic data sets. To provide the CM host we can copy the FQDN of the node where Cloudera Manager is running.
Number 6 on our list is a sales graph example that offers a detailed snapshot of sales conversion rates. With a host of interactive sales graphs and specialized charts, this sales graph template is a shining example of how to present sales data for your business. 6) Sales Conversion. The Secret To Sales Success: Knowing Your Numbers.
Today, customers widely use OpenSearch Service for operational analytics because of its ability to ingest high volumes of data while also providing rich and interactive analytics. As your operational analytics data velocity and volume of data grows, bottlenecks may emerge.
Table of Contents 1) Benefits Of Big Data In Logistics 2) 10 Big Data In Logistics Use Cases Big data is revolutionizing many fields of business, and logistics analytics is no exception. According to studies, 92% of data leaders say their businesses saw measurable value from their data and analytics investments.
Customers across diverse industries rely on Amazon OpenSearch Service for interactive log analytics, real-time application monitoring, website search, vector database, deriving meaningful insights from data, and visualizing these insights using OpenSearch Dashboards. Under Generate the link as , select Snapshot and choose Copy iFrame code.
Organizations with legacy, on-premises, near-real-time analytics solutions typically rely on self-managed relational databases as their data store for analytics workloads. Near-real-time streaming analytics captures the value of operational data and metrics to provide new insights to create business opportunities.
Storytelling through data is the process of transforming data-driven analyses into a widely-accessible visual format to influence a business decision, strategy, or action by utilizing analytical information that, ultimately, turn into actionable insights. Data storytelling has a host of business-boosting benefits. click to enlarge**.
Amazon Redshift is a fast, fully managed, petabyte-scale data warehouse that provides the flexibility to use provisioned or serverless compute for your analytical workloads. Modern analytics is much wider than SQL-based data warehousing. Solution overview AWS SCT uses a service account to connect to your Azure Synapse Analytics.
Moreover, within just five years, the number of smart connected devices in the world will amount to more than 22 billion – all of which will produce colossal sets of collectible, curatable, and analyzable data, claimed IoT Analytics in their industry report. What does this mean? 3) Consider your data sources. click to enlarge**.
This post focuses on an even lower-level pattern, when data scientists are themselves implementing solutions to analytical problems within the software system codebase. These snapshots comprise what we refer to as our search index. Whenever a snapshot’s contents match its real-world counterpart, we call that snapshot ‘fresh.’
One key component that plays a central role in modern data architectures is the data lake, which allows organizations to store and analyze large amounts of data in a cost-effective manner and run advanced analytics and machine learning (ML) at scale. Moreover, running advanced analytics and ML on disparate data sources proved challenging.
In practice, let’s say you have created an interactive analytics dashboard with 4 different tabs, and you want to be able to apply one filter to all the tabs that you’re working on. For example, you may have different SQL databases, Google Analytics, and sales data in a CSV. They all host invaluable data for your business.
Financial analytics can be kept under control with its numerous features that can remove complexities and establish a healthy and holistic overview of all the financial information a company manages. Of course, the main goal is to increase customers’ lifetime value while decreasing acquisition costs. Let’s see another example.
Without big data analytics, companies are blind and deaf, wandering out onto the Web like deer on a freeway. Companies that use data analytics are five times more likely to make faster decisions, based on a survey conducted by Bain & Company. Geoffrey Moore, Author of Crossing the Chasm & Inside the Tornado.
BI tools access and analyze data sets and present analytical findings in reports, summaries, dashboards, graphs, charts, and maps to provide users with detailed intelligence about the state of the business. Whereas BI studies historical data to guide business decision-making, business analytics is about looking forward.
Tens of thousands of customers use Amazon Redshift to process exabytes of data every day to power their analytics workloads. Redshift Test Drive is a tool hosted on the GitHub repository that let customers evaluate which data warehouse configurations options are best suited for their workload.
All areas of your modern-day business – from supply chain success to improved reporting processes and communications, interdepartmental collaboration, and general organization innovation – can benefit significantly from the use of analytics, structured into a live dashboard that can improve your data management efforts. click to enlarge**.
You can store your data as-is, without having to first structure the data and then run different types of analytics for better business insights. Analytics use cases on data lakes are always evolving. Unlike migrate or snapshot, add_files can import files from a specific partition or partitions and doesn’t create a new Iceberg table.
The newly introduced OR1 instances are ideally tailored for heavy indexing use cases like log analytics and observability workloads. You can install OpenSearch Benchmark directly on a host running Linux or macOS , or you can run OpenSearch Benchmark in a Docker container on any compatible host.
A procurement report allows an organization to demonstrate how its procurement activities deliver value for money, contribute to the realization of its broader goals and objectives, and provide a panoramic snapshot of the effectiveness of its procurement strategy. There are a host of benefits to procurement reporting.
The connectors were only able to reference hostnames in the connector configuration or plugin that are publicly resolvable and couldn’t resolve private hostnames defined in either a private hosted zone or use DNS servers in another customer network. Many customers ensure that their internal DNS applications are not publicly resolvable.
Tens of thousands of customers use Amazon Redshift to process exabytes of data every day to power their analytics workloads. Redshift Test Drive also provides additional features such as a self-hosted analysis UI and the ability to replicate external objects that a Redshift workload may interact with.
Apache HBase is a scalable, distributed, column-oriented data store that provides real-time read/write random access to very large datasets hosted on Hadoop Distributed File System (HDFS). In this method, you prepare the data for migration, and then set up the replication plugin to use a snapshot to migrate your data. using CM 6.3.0
In the following sections, we discuss the most common areas of consideration that are critical for Data Vault implementations at scale: data protection, performance and elasticity, analytical functionality, cost and resource management, availability, and scalability. Manual snapshots can be kept indefinitely at standard Amazon S3 rates.
Traditionally, customers used batch-based approaches for data movement from operational systems to analytical systems. A batch-based approach can introduce latency in data movement and reduce the value of data for analytics. Data silos causes data to live in different sources, which makes it difficult to perform analytics.
Answer : Along with standard RDS features, Amazon RDS for Db2 supports key Db2 features, such as row and column organized tables for mixed and analytic workloads, the Adaptive Workload Optimizer to for better resource management, and rules-based access controls for advanced data protection. Scalability 5.
Here, we’ll explore customer data management, offering a host of practical tips to help you embrace the power of customer data management software the right way. Such inconsistencies can have a huge effect on the way data is organized through a host of different management systems within a company. click to enlarge**.
It is designed to simplify deployment, configuration, and serviceability of Solr-based analytics applications. The Data Discovery and Exploration template contains the most commonly used services in search analytics applications. See the snapshot below. data best served through Apache Solr). What does DDE entail?
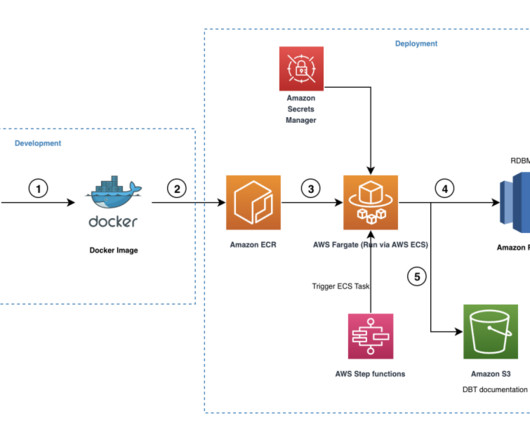
In this post, we assume the following three accounts: Pipeline account – This hosts the end-to-end pipeline Dev account – This hosts the integration pipeline in the development environment Prod account – This hosts the data integration pipeline in the production environment If you want, you can use the same account and the same Region for all three.
Equipped with financial analytics software , you can easily produce these daily, weekly, and monthly reports. This particular monthly financial report template provides you with an overview of how efficiently you are spending your capital while providing a snapshot of the main metrics on your balance sheet. click to enlarge**.
But in this digital age, dynamic modern IT reports created with a state-of-the-art online reporting tool are here to help you provide viable answers to a host of burning departmental questions. Communicate your findings and see what they have analyzed and dug out from the analytics. “ Everything is designed.
Customers have been using data warehousing solutions to perform their traditional analytics tasks. Recently, data lakes have gained lot of traction to become the foundation for analytical solutions, because they come with benefits such as scalability, fault tolerance, and support for structured, semi-structured, and unstructured datasets.
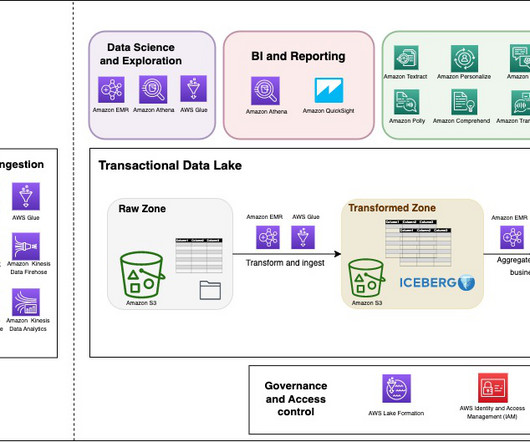
AWS provides flexibility and a wide breadth of features to ingest data, build AI and ML applications, and run analytics workloads without having to focus on the undifferentiated heavy lifting. The transformed zone is an enterprise-wide zone to host cleaned and transformed data in order to serve multiple teams and use cases.
One of the most effective Twitter KPIs , the ‘top 5 Tweets’ metric offers a clear, concise, and digestible visual snapshot of your most engaging Tweets over a specific period of time. It can also help you to create your own analytical report that can reduce your time in analyzing the vast amount of data. 4) CPM of Twitter Ads.
In this post, we share how Poshmark improved CX and accelerated revenue growth by using a real-time analytics solution. High-level challenge: The need for real-time analytics Previous efforts at Poshmark for improving CX through analytics were based on batch processing of analytics data and using it on a daily basis to improve CX.
We organize all of the trending information in your field so you don't have to. Join 42,000+ users and stay up to date on the latest articles your peers are reading.
You know about us, now we want to get to know you!
Let's personalize your content
Let's get even more personalized
We recognize your account from another site in our network, please click 'Send Email' below to continue with verifying your account and setting a password.


Let's personalize your content