This site uses cookies to improve your experience. To help us insure we adhere to various privacy regulations, please select your country/region of residence. If you do not select a country, we will assume you are from the United States. Select your Cookie Settings or view our Privacy Policy and Terms of Use.
Cookie Settings
Cookies and similar technologies are used on this website for proper function of the website, for tracking performance analytics and for marketing purposes. We and some of our third-party providers may use cookie data for various purposes. Please review the cookie settings below and choose your preference.
Used for the proper function of the website
Used for monitoring website traffic and interactions
Cookie Settings
Cookies and similar technologies are used on this website for proper function of the website, for tracking performance analytics and for marketing purposes. We and some of our third-party providers may use cookie data for various purposes. Please review the cookie settings below and choose your preference.
Strictly Necessary: Used for the proper function of the website
Performance/Analytics: Used for monitoring website traffic and interactions
Introduction In the field of Data Science main types of online processing systems are Online Transaction Processing (OLTP) and Online Analytical Processing (OLAP), which are used in most companies for transaction-oriented applications and analytical work.
One of the most valuable tools available is OLAP. This tool can be great for handing SQL queries and other data queries. Every data scientist needs to understand the benefits that this technology offers. Using OLAP Tools Properly. Several or more cubes are used to separate OLAP databases. see more ).
Executives increasingly rely on data and advanced analytics to make business decisions. They also need the ability to access and parse that data faster and in more creative ways. Meanwhile, the data that businesses have access to and the number of systems producing that data are growing at lightspeed.
Amazon Redshift is a fully managed, petabyte-scale, massively parallel datawarehouse that makes it fast, simple, and cost-effective to analyze all your data using standard SQL and your existing business intelligence (BI) tools. This will allow for a smoother migration of OLAP workloads, with minimal rewrites.
Deriving business insights by identifying year-on-year sales growth is an example of an online analytical processing (OLAP) query. These types of queries are suited for a datawarehouse. Amazon Redshift is fully managed, scalable, cloud datawarehouse. This dimensional model will be built in Amazon Redshift.
This blog is intended to give an overview of the considerations you’ll want to make as you build your Redshift datawarehouse to ensure you are getting the optimal performance. OLTP vs OLAP. First, we’ll dive into the two types of databases: OLAP (Online Analytical Processing) and OLTP (Online Transaction Processing).
Online analytical processing (OLAP) database systems and artificial intelligence (AI) complement each other and can help enhance data analysis and decision-making when used in tandem. As AI techniques continue to evolve, innovative applications in the OLAP domain are anticipated.
Datawarehouse vs. databases Traditional vs. Cloud Explained Cloud datawarehouses in your data stack A data-driven future powered by the cloud. We live in a world of data: There’s more of it than ever before, in a ceaselessly expanding array of forms and locations. Datawarehouse vs. databases.
Amazon Redshift is a fast, fully managed, petabyte-scale datawarehouse that provides the flexibility to use provisioned or serverless compute for your analytical workloads. Modern analytics is much wider than SQL-based data warehousing. Fault tolerance is built in. Any hardware failures are automatically replaced.
For more sophisticated multidimensional reporting functions, however, a more advanced approach to staging data is required. The DataWarehouse Approach. Datawarehouses gained momentum back in the early 1990s as companies dealing with growing volumes of data were seeking ways to make analytics faster and more accessible.
For more powerful, multidimensional OLAP-style reporting, however, it falls short. OLAP reporting has traditionally relied on a datawarehouse. OLAP reporting based on a datawarehouse model is a well-proven solution for companies with robust reporting requirements. Azure Data Lakes are complicated.
A DSS leverages a combination of raw data, documents, personal knowledge, and/or business models to help users make decisions. The data sources used by a DSS could include relational data sources, cubes, datawarehouses, electronic health records (EHRs), revenue projections, sales projections, and more.
This post provides guidance on how to build scalable analytical solutions for gaming industry use cases using Amazon Redshift Serverless. Flexible and easy to use – The solutions should provide less restrictive, easy-to-access, and ready-to-use data. A datawarehouse is one of the components in a data hub.
BI tools access and analyze data sets and present analytical findings in reports, summaries, dashboards, graphs, charts, and maps to provide users with detailed intelligence about the state of the business. Whereas BI studies historical data to guide business decision-making, business analytics is about looking forward.
Amazon Redshift is a fully managed, petabyte-scale datawarehouse service in the cloud. Tens of thousands of customers use Amazon Redshift to process exabytes of data every day to power their analytics workloads. This data must also reflect the initial creation time and last update time for auditing and tracking purposes.
Amazon Redshift is a recommended service for online analytical processing (OLAP) workloads such as cloud datawarehouses, data marts, and other analyticaldata stores. These campaigns are optimized by using an AI-based bid process that requires running hundreds of analytical queries per campaign.
Many of the features frequently attributed to AI in business, such as automation, analytics, and data modeling aren’t actually features of AI at all. Which problems do disparate data points speak to? Enter data warehousing.
Designing databases for datawarehouses or data marts is intrinsically much different than designing for traditional OLTP systems. In fact, many commonly accepted best practices for designing OLTP databases could well be considered worst practices for these purely analytical systems. Analytical. Business Focus.
Large-scale datawarehouse migration to the cloud is a complex and challenging endeavor that many organizations undertake to modernize their data infrastructure, enhance data management capabilities, and unlock new business opportunities. This makes sure the new data platform can meet current and future business goals.
For organizations considering a move to Microsoft Dynamics 365 Finance & Supply Chain Management (D365 F&SCM), or for those in the early stages of an implementation project, defining a clear strategy for curating data is a key to developing a comprehensive approach to reporting and analytics. Enterprise Business Intelligence.
Technicals such as datawarehouse, online analytical processing (OLAP) tools, and data mining are often binding. On the opposite, it is more of a comprehensive application of datawarehouse, OLAP, data mining, and so forth. Predictive analytics and modeling.
To show you exactly what you will gain by replacing MR with Jet, we’ve compared specific features in three of our products (Jet Basics, Jet Reports and Jet Analytics) with the features you are currently using. Option 3: Jet Analytics. Jet Analytics. Multi Data Source Consolidation. DataWarehouse and OLAP Cubes.
Also known as “analytics,” BI looks at more expansive data relationships, perhaps even between multiple systems that collect data (such as CRM and GP), and identifies trends that can inform strategic business decisions and objectives that will improve overall performance across the entire operation.
When we talk about business intelligence system, it normally includes the following components: datawarehouse BI software Users with appropriate analytical. Data analysis and processing can be carried out while ensuring the correctness of data. DataWarehouse. Data Analysis.
But data alone is not the answer—without a means to interact with the data and extract meaningful insight, it’s essentially useless. Business intelligence (BI) software can help by combining online analytical processing (OLAP), location intelligence, enterprise reporting, and more. Data Mining and Business Intelligence.
With Jet Analytics from insightsoftware , users in the finance and accounting department can connect easily to Microsoft Dynamics data (and to other data sources) to get immediate access to all of the information they need for robust reporting and analysis. The Easy Path to BI. Those systems contain valuable information.
First, accounting moved into the digital age and made it possible for data to be processed and summarized more efficiently. Spreadsheets enabled finance professionals to access data faster and to crunch the numbers with much greater ease. Today’s technology takes this evolution a step further.
Which problems do disparate data points speak to? And how can the data collected across multiple touchpoints, from retail locations to the supply chain to the factory be easily integrated? Enter data warehousing. To truly benefit from artificial intelligence, you need to set the stage with effective reporting and analytics.
TIBCO Jaspersoft offers a complete BI suite that includes reporting, online analytical processing (OLAP), visual analytics , and data integration. The web-scale platform enables users to share interactive dashboards and data from a single page with individuals across the enterprise. Data Security.
Every aspect of analytics is powered by a data model. A data model presents a “single source of truth” that all analytics queries are based on, from internal reports and insights embedded into applications to the data underlying AI algorithms and much more. OLTP does not hold historical data, only current data.
Key use cases Accelerate TDR with AI-powered unified analyst experience (UAX) QRadar Log Insights provides a simplified and unified analyst experience so your security operations team can visualize and perform analytics using all your security-related data, regardless of the location or the type of data source.
The world of business analytics is evolving rapidly. As ERP moves to the cloud, software vendors are developing more sophisticated, interconnected ways of gathering, organizing, and analyzing business data. OLAP Cubes vs. Tabular Models. Let’s begin with an overview of how dataanalytics works for most business applications.
And enterprise reporting is the primary data visualization technology in most enterprises. . Therefore, business intelligence is a broader category that includes data processing, perform reporting, analytics, and visualization functions. And enterprise reporting is a more specific category within BI.
Built from the bones of Dynamics AX, the cloud-based Dynamics 365 Finance & Operations (D365FO) has introduced some new out-of-the-box reporting and analytical capabilities to customers. 4 Common Issues with Using Data Entities. Data entities join and link your data in D365FO to make it easier to write a report.
As the data visualization, big data, Hadoop, Spark and self-service hype gives way to IoT, AI and Machine Learning, I dug up an old parody post on the business intelligence market circa 2007-2009 when cloud analytics was just a disruptive idea. Thanks to The OLAP Report for lots of great market materials.
Power BI has definite strengths, including its tight integration with the Microsoft stack and strong data visualization capabilities, but the product is not necessarily well-suited to replace traditional reporting or analysis tools, especially so when it comes to financial reporting. Building Customer Stickiness around Reporting.
Using OBIEE as Discoverer’s replacement is intended to help unlock the power of your information with robust reporting, ad hoc query and analysis, OLAP, dashboard, and scorecard functionality that offers the end user an experience that comes with visualization, collaboration, alert capabilities, and more. But does OBIEE stack up?
Thanks to the recent technological innovations and circumstances to their rapid adoption, having a datawarehouse has become quite common in various enterprises across sectors. This also applies to businesses that may not have a datawarehouse and operate with the help of a backend database system.
Thanks to the recent technological innovations and circumstances to their rapid adoption, having a datawarehouse has become quite common in various enterprises across sectors. This also applies to businesses that may not have a datawarehouse and operate with the help of a backend database system.
I was pricing for a data warehousing project with just 4 TBs of data, small by today’s standards. I chose “ON Demand” for up to 64 virtual CPUs and 448 GB of memory since I wanted this datawarehouse to fit entirely, or at least mostly, within memory. Figure 1: Pricing for a 4 TB datawarehouse in AWS.
The term “ business intelligence ” (BI) has been in common use for several decades now, referring initially to the OLAP systems that drew largely upon pre-processed information stored in datawarehouses. The use of BI and other big data technologies as value drivers continues to grow. The Future Is Now. BI has arrived.
Which problems do disparate data points speak to? And how can the data collected across multiple touchpoints, from retail locations to the supply chain to the factory be easily integrated? Enter data warehousing. To truly benefit from artificial intelligence, you need to set the stage with effective reporting and analytics.
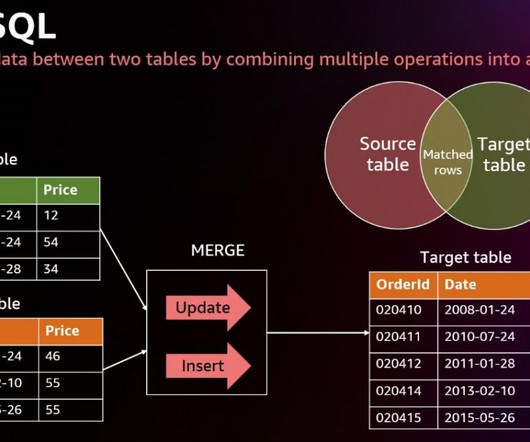
That speaks to the remarkable learning curve aspects of SQL, how oh-so-much data munging can be performed without having to sweat the details. Clearly, SQL helps reduce cognitive load for those who are learning about data management and analytics. SQL and Spark. Nope, that genie is out of the bottle.
Bring any data to any data consumer, simply and easily: that’s the goal of data virtualization. Yet contrary to what may first come to mind, data consumers are more than simply BI, analytics, or data science applications. Just about every.
We organize all of the trending information in your field so you don't have to. Join 42,000+ users and stay up to date on the latest articles your peers are reading.
You know about us, now we want to get to know you!
Let's personalize your content
Let's get even more personalized
We recognize your account from another site in our network, please click 'Send Email' below to continue with verifying your account and setting a password.


Let's personalize your content