This site uses cookies to improve your experience. To help us insure we adhere to various privacy regulations, please select your country/region of residence. If you do not select a country, we will assume you are from the United States. Select your Cookie Settings or view our Privacy Policy and Terms of Use.
Cookie Settings
Cookies and similar technologies are used on this website for proper function of the website, for tracking performance analytics and for marketing purposes. We and some of our third-party providers may use cookie data for various purposes. Please review the cookie settings below and choose your preference.
Used for the proper function of the website
Used for monitoring website traffic and interactions
Cookie Settings
Cookies and similar technologies are used on this website for proper function of the website, for tracking performance analytics and for marketing purposes. We and some of our third-party providers may use cookie data for various purposes. Please review the cookie settings below and choose your preference.
Strictly Necessary: Used for the proper function of the website
Performance/Analytics: Used for monitoring website traffic and interactions
Importance of Dashboards Dashboards […] The post 20 Examples of Interactive Power BI Dashboards appeared first on Analytics Vidhya. From sales and marketing to HR and social media, these dashboards offer inspiration for your data visualization projects.
The post Interactive Tweet Sentiment Visualization appeared first on Analytics Vidhya. This data corresponds to either the opinion of people on political matters, on products they use, or on the services they use from companies. Mining this […].
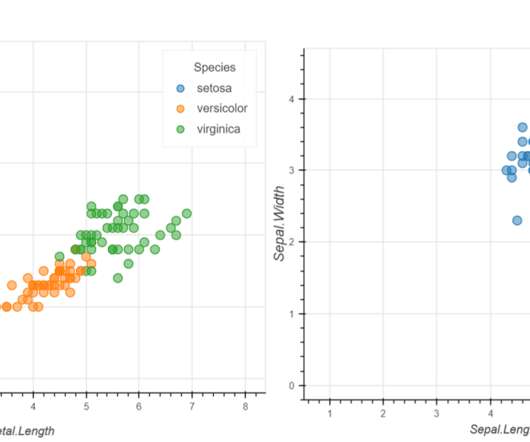
The post Interactive Data Visualization using rbokeh appeared first on Analytics Vidhya. Several charts are available for specific purposes, like bar charts to present categorical distribution, line charts to […].
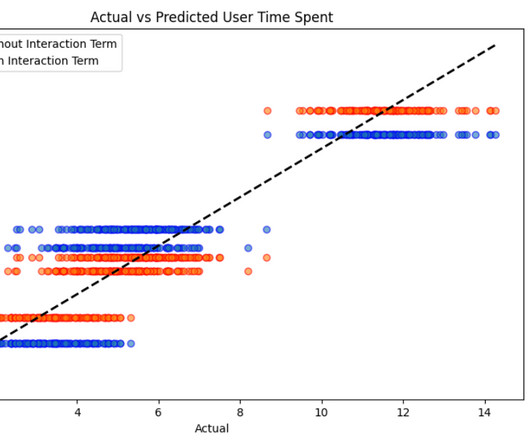
Introduction Interaction terms are incorporated in regression modelling to capture the effect of two or more independent variables in the dependent variable. These are also […] The post A Guide to Understanding Interaction Terms appeared first on Analytics Vidhya.
Generative AI is upending the way product developers & end-users alike are interacting with data. Despite the potential of AI, many are left with questions about the future of product development: How will AI impact my business and contribute to its success?
With the growing importance of data science and machine learning, data analysis holds a special place in […] The post Creating Interactive and Animated Charts with ipyvizzu appeared first on Analytics Vidhya.
This blog post introduces a pioneering approach that liberates and not only liberates but also maximizes the utility of data from PDFs. […] The post Transforming PDF Images into Interactive Dialogues with AI appeared first on Analytics Vidhya.
Introduction Imagine being a medical student needing to visualize complex anatomical structures or a data scientist creating interactive 3D models. PyVista offers the precision and interactivity required to make these tasks engaging and insightful.
In today’s ambitious business environment, customers want access to an application’s data with the ability to interact with the data in a way that allows them to derive business value. After all, customers rely on your application to help them understand the data that it holds, especially in our increasingly data-savvy world.
In this guide, we’ll embark on a journey exploring the seamless integration of ChatGPT plugins into the blogging world, uncovering […] The post Guide to Safely Transforming Interactions with ChatGPT Plugins appeared first on Analytics Vidhya.
This is where human-computer interaction (HCI) comes into play. HCI is a specialized field of study and research focusing on creating user-friendly and interactive human computer […] The post Introduction to Human Computer Interaction (HCI) With Examples appeared first on Analytics Vidhya.
It’s like having […] The post Poe’s Multi-Bot Chat: A Game-Changer in AI Interactivity appeared first on Analytics Vidhya. This means you can get a variety of viewpoints on any topic, making your conversations richer and more helpful.
Welcome to the Python Database Interaction MCQs! Database interaction is a fundamental aspect of many Python applications, allowing you to store, retrieve, and manipulate data in various database systems. Python provides several libraries such as sqlite3, MySQLdb, psycopg2, and sqlalchemy to interact with databases.
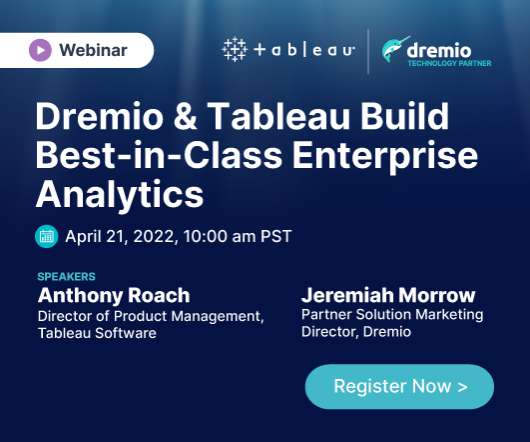
Speaker: Anthony Roach, Director of Product Management at Tableau Software, and Jeremiah Morrow, Partner Solution Marketing Director at Dremio
As a result, these two solutions come together to deliver: Lightning-fast BI and interactiveanalytics directly on data wherever it is stored. A self-service platform for data exploration and visualization that broadens access to analytic insights. A seamless and efficient customer experience.
One among them is the OpenAI Assistant API, i.e., chatbots. […] The post Elevate User Experience: Implementing OpenAI Assistant API for Interactive Chatbots appeared first on Analytics Vidhya.
Google’s latest endeavor, Gemini, is poised to redefine user interaction in the digital landscape. Let’s explore the features of Google’s […] The post Google Gemini Ultra: Redefining User Interaction with Advanced AI appeared first on Analytics Vidhya.
In the era of AI, chatbots have revolutionized how we interact with technology. Flask and Vector Embedding appeared first on Analytics Vidhya. Flask and Vector Embedding appeared first on Analytics Vidhya. Perhaps one of the most impactful uses is in the healthcare industry.
This improvement streamlines the ability to access and manage your Airflow environments and their integration with external systems, and allows you to interact with your workflows programmatically. Airflow REST API The Airflow REST API is a programmatic interface that allows you to interact with Airflow’s core functionalities.
Discover which features will differentiate your application and maximize the ROI of your embedded analytics. Brought to you by Logi Analytics. But today, dashboards and visualizations have become table stakes.
Introduction Pandas’ Python profiling package produces an interactive set of tables and visualizations for exploratory data exploration (EDA). The post Pandas Profiling – A Visual Analytics Wonder appeared first on Analytics Vidhya. and all the coding techniques and properties.
As businesses increasingly rely on digital platforms to interact with customers, the need for advanced tools to understand and optimize these experiences has never been greater. Enter Gen AI, a transformative force reshaping digital experience analytics (DXA). That’s where Gen AI comes in. The future of Gen AI in DXA: What’s next?
Try Metabase, an open-source Business Intelligence (BI) tool for creating interactive dashboards from large datasets. Learning […] The post Open-Source BI Tool Metabase for Data Visualization and Analytics appeared first on Analytics Vidhya. Introduction Are you a passionate data professional exploring new tools?
As interactions in various fields become more nuanced, the demand for chatbots that can seamlessly manage multiple participants and complex workflows grows. In our previous article, […] The post Hands-on Guide to Building Multi-Agent Chatbots with Autogen appeared first on Analytics Vidhya.
How AI-powered analytics are leading to more intriguing and satisfying customer interactions. The growing demand among buyers for open marketing platforms that can support “BYOD” (bring your own data).
It aims to streamline the coordination of AI agents through scalable and user-friendly mechanisms, making it easier to manage interactions within complex workflows.
This memory transforms chatbots from simple Q&A machines into sophisticated conversational partners, capable of handling complex topics over multiple interactions. In this article, we dive into the fascinating world of […] The post Enhancing AI Conversations with LangChain Memory appeared first on Analytics Vidhya.
When combined with LlamaIndex, it becomes a powerful tool for visualizing and interacting with knowledge graphs in real time. appeared first on Analytics Vidhya.
Its in beta testing, but its already shaking up how AI can interact with software. Theyre […] The post Anthropic Computer Use: AI Assitant Taking Over Your Computer appeared first on Analytics Vidhya. Anthropic’s latest update introduces this cool capability to their AI model, Claude.
Speaker: Dean Yao, Sr. Director of Product Marketing, Logi Analytics
Businesses are run with analytics - but companies continue to struggle with interpreting, analyzing, and distributing data. Operational reports help get information to the people who need it most, in formats they understand, and in a timeframe that matters. You’ll learn: Best practices for embedding operational reports in your application.
Introduction In today’s digital world, Large Language Models (LLMs) are revolutionizing how we interact with information and services. LLMs are advanced AI systems designed to understand and generate human-like text based on vast amounts of data.
Creating AI agents that can interact with the real world is a great area of research and development. 70B appeared first on Analytics Vidhya. 70B appeared first on Analytics Vidhya. One useful application is building agents capable of searching the web to gather information and complete tasks.
These models are valuable tools for storytelling, content creation, and interactive systems, but evaluating the quality of their outputs remains challenging. Traditional human evaluation is subjective and […] The post NVIDIA’s Nemotron-4-340B Assesses the Creativity of Gemini and GPT-4 appeared first on Analytics Vidhya.
Language models have transformed how we interact with data, enabling applications like chatbots, sentiment analysis, and even automated content generation. However, most discussions revolve around large-scale models like GPT-3 or GPT-4, which require significant computational resources and vast datasets.
Speaker: Magnus Penker, CEO & Founder, Innovation360 Group
Welcome to an interactive empowering session on how to sharpen your future through innovation management, which can help guide your company’s goals. The assessment is a personalized 40-page report containing analytics, benchmark and recommendations on how to sharpen your strategy, leadership, culture, and capabilities for innovation.
The LangGraph ReAct Function-Calling Pattern offers a powerful framework for integrating various tools like search engines, calculators, and APIs with an intelligent language model to create a more interactive and responsive system.
Amazon Kinesis Data Analytics for SQL is a data stream processing engine that helps you run your own SQL code against streaming sources to perform time series analytics, feed real-time dashboards, and create real-time metrics. AWS has made the decision to discontinue Kinesis Data Analytics for SQL, effective January 27, 2026.
AI agents are autonomous intelligent systems that can interact with their environment, make decisions, and take action […] The post The Effect of AI Agents in the Job Market in 2025 appeared first on Analytics Vidhya. One of the most significant ways AI is impacting the job market is through the use of AI agents.
Microsoft‘s business analytics product, Power BI, delivers interactive data visualization BI capabilities that allow users to see and share data and insights throughout their organisation. Power BI provides insight data by using data interactively and exploring it by visualizations. […]. What is Power BI?
Speaker: Nicholas Zeisler, CX Strategist & Fractional CXO
Are you excited to actually start making sense of customer analytics? Today, far too many brands do VoC simply because that’s what they think they’re supposed to do; that’s what all their competitors do. NPS and C-SAT become the keys to the realm, but offer no true insights. So how do you reach a place where VoC actually provides clarity?
OpenAI, a leading AI company, offers API keys for developers to interact with its platform and utilize its LLM models in various projects. appeared first on Analytics Vidhya. In this article, you’ll learn how to create your own OpenAI API Key, updated as of 2024.
to offer context-aware interactions that boost productivity and engagement. appeared first on Analytics Vidhya. This advanced chatbot uses the company’s most powerful language model, which is currently Llama 3.2, As we explore the […] The post How Can Meta AI on WhatsApp Transform Your Mobile Experience?
Introduction Azure Databricks is a fast, easy, and collaborative Apache Spark-based analytics platform that is built on top of the Microsoft Azure cloud. A collaborative and interactive workspace allows users to perform big data processing and machine learning tasks easily.
Google has introduced the Google Gen AI Toolbox for Databases, an open-source Python library designed to simplify database interaction with GenAI. As part of its public […] The post Google Gen AI Toolbox: A Python Library for SQL Databases appeared first on Analytics Vidhya.
Speaker: Nik Gowing, Brenda Laurel, Sheridan Tatsuno, Archie Kasnet, and Bruce Armstrong Taylor
When community members can be empowered "architects" of a "bottoms-up" planning approach, where citizens become stakeholders in circular-city projects and programs by interactively participating in immersive, experiential simulations? This is a panel discussion you won't want to miss! May 5, 2021 at 9:30 am PDT, 12:30 pm EDT, 5:30 pm GMT.
We organize all of the trending information in your field so you don't have to. Join 42,000+ users and stay up to date on the latest articles your peers are reading.
You know about us, now we want to get to know you!
Let's personalize your content
Let's get even more personalized
We recognize your account from another site in our network, please click 'Send Email' below to continue with verifying your account and setting a password.


Let's personalize your content