This site uses cookies to improve your experience. To help us insure we adhere to various privacy regulations, please select your country/region of residence. If you do not select a country, we will assume you are from the United States. Select your Cookie Settings or view our Privacy Policy and Terms of Use.
Cookie Settings
Cookies and similar technologies are used on this website for proper function of the website, for tracking performance analytics and for marketing purposes. We and some of our third-party providers may use cookie data for various purposes. Please review the cookie settings below and choose your preference.
Used for the proper function of the website
Used for monitoring website traffic and interactions
Cookie Settings
Cookies and similar technologies are used on this website for proper function of the website, for tracking performance analytics and for marketing purposes. We and some of our third-party providers may use cookie data for various purposes. Please review the cookie settings below and choose your preference.
Strictly Necessary: Used for the proper function of the website
Performance/Analytics: Used for monitoring website traffic and interactions
Overview OLTP and OLAP are 2 data processing capabilities Understand the difference between OLTP and OLAP Introduction You acquire new information every day. The post Data Engineering for Beginners – Difference Between OLTP and OLAP appeared first on Analytics Vidhya.
Introduction In the field of Data Science main types of online processing systems are Online Transaction Processing (OLTP) and Online Analytical Processing (OLAP), which are used in most companies for transaction-oriented applications and analytical work. In the Database Management System, both OLAP and OLTP play […].
One of the most valuable tools available is OLAP. Using OLAP Tools Properly. Online analytical processing is a computer method that enables users to retrieve and query data rapidly and carefully in order to study it from a variety of angles. Several or more cubes are used to separate OLAP databases. see more ).
Apache Pinot, an open-source OLAP datastore, offers the ability to handle real-time data ingestion and low-latency querying, making it […] The post Real-Time App Performance Monitoring with Apache Pinot appeared first on Analytics Vidhya.
Introduction DuckDB is designed to support analytical query workloads, also known as Online analytical processing (OLAP).” The post DuckDB: An Introduction appeared first on Analytics Vidhya. In short, […].
This is how the Online Analytical Processing (OLAP) cube was born, which you might call one of the grooviest BI inventions developed in the 70s. OLAP cube is designed as a solution to pre-compute totals and subtotals when the database server is idle. Saving time and headaches with online analytical processing tool.
Online Analytical Processing (OLAP) is crucial in modern data-driven apps, acting as an abstraction layer connecting raw data to users for efficient analysis. OLAP combines data from various data sources and aggregates and groups them as business terms and KPIs. You can use Amazon Managed Service for Apache Flink service.
We are continuously investing to make analytics easy with Redshift by simplifying SQL constructs and adding new operators. Solution overview Online Analytical Processing (OLAP) is an effective tool for today’s data and business analysts. This will allow for a smoother migration of OLAP workloads, with minimal rewrites.
Online analytical processing (OLAP) database systems and artificial intelligence (AI) complement each other and can help enhance data analysis and decision-making when used in tandem. As AI techniques continue to evolve, innovative applications in the OLAP domain are anticipated.
The terms “reporting” and “analytics” are often used interchangeably. In fact there are some very important differences between the two, and understanding those distinctions can go a long way toward helping your organization make best use of both financial reporting and analytics. What About Financial Analytics?
From what I can remember, in-memory analytics, mobile BI, OLAP cubes and easier to use drag-and-drop analytics tools got all the buzz. by Jen Underwood. What was hot and what was not? Read More.
Amazon Redshift is a fast, fully managed, petabyte-scale data warehouse that provides the flexibility to use provisioned or serverless compute for your analytical workloads. Modern analytics is much wider than SQL-based data warehousing. Solution overview AWS SCT uses a service account to connect to your Azure Synapse Analytics.
BI tools access and analyze data sets and present analytical findings in reports, summaries, dashboards, graphs, charts, and maps to provide users with detailed intelligence about the state of the business. Whereas BI studies historical data to guide business decision-making, business analytics is about looking forward.
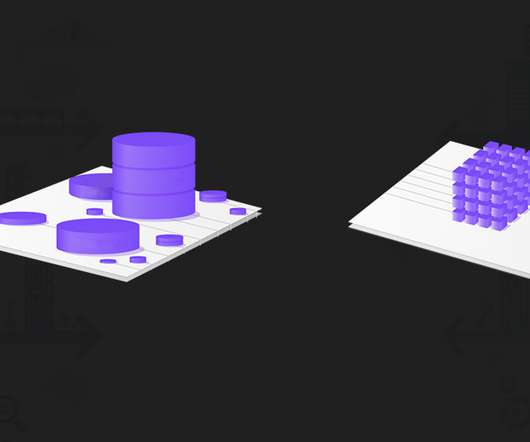
Redshift, like BigQuery and Snowflake, is a cloud-based distributed multi-parallel processing (MPP) database, built for big data sets and complex analytical workflows. OLTP vs OLAP. First, we’ll dive into the two types of databases: OLAP (Online Analytical Processing) and OLTP (Online Transaction Processing).
This is where Business Analytics (BA) and Business Intelligence (BI) come in: both provide methods and tools for handling and making sense of the data at your disposal. So…what is the difference between business intelligence and business analytics? What Does “Business Analytics” Mean? What’s In a Name? Let’s take a closer look.
For more powerful, multidimensional OLAP-style reporting, however, it falls short. OLAP reporting has traditionally relied on a data warehouse. OLAP reporting based on a data warehouse model is a well-proven solution for companies with robust reporting requirements. Azure Data Lakes are complicated.
Data warehouses gained momentum back in the early 1990s as companies dealing with growing volumes of data were seeking ways to make analytics faster and more accessible. Online analytical processing (OLAP), which enabled users to quickly and easily view data along different dimensions, was coming of age. Data Lakes.
It is best for tracking marketing activities because DataBox supports dozens of one-click integrations with sources such as Google Analytics, Facebook, Salesforce, Shopify. . Databox is a free cloud-based BI tool that provides a single interface for marketers, CEOs, analysts to track KPIs and generate reports. .
But what most people don’t realize is that behind the scenes, Uber is not just a transportation service; it’s a data and analytics powerhouse. This blog takes you on a journey into the world of Uber’s analytics and the critical role that Presto, the open source SQL query engine, plays in driving their success.
Bayer Crop Science has applied analytics and decision-support to every element of its business, including the creation of “virtual factories” to perform “what-if” analyses at its corn manufacturing sites. QlikView is Qlik’s classic analytics solution, built on the company’s Associative Engine. Analytics, Data Science
This post provides guidance on how to build scalable analytical solutions for gaming industry use cases using Amazon Redshift Serverless. The following diagram is a conceptual analytics data hub reference architecture. This reference architecture partly combines a data hub and data lake to enable comprehensive analytics services.
Model-based analysis like OLAP analysis on cubes or ad hoc analysis based on semantic models provides greater flexibility for end users to pull information out of their information landscape. Figure 1: Which analytical formats does your company currently use, or plan to use in the future? (n=249). The Last Mile of Analytics.
The former is more professional in report making, presentation, and printing, while the latter can make OLAP and predict analysis thanks to the BI capabilities. As reporting software, it does not support OLAP. Zoho Analytics. Zoho Analytics is a cloud-based self -service BI with reporting capabilities. Agency Analytics.
Many of the features frequently attributed to AI in business, such as automation, analytics, and data modeling aren’t actually features of AI at all. Cubes are multi-dimensional datasets that are optimized for analytical processing applications such as AI or BI solutions.
Technicals such as data warehouse, online analytical processing (OLAP) tools, and data mining are often binding. On the opposite, it is more of a comprehensive application of data warehouse, OLAP, data mining, and so forth. Predictive analytics and modeling. BI software solutions (by FineReport).
Business intelligence (BI) software can help by combining online analytical processing (OLAP), location intelligence, enterprise reporting, and more. Store and manage: Next, businesses store and manage the data in a multidimensional database system, such as OLAP or tabular cubes. Data Mining and Business Intelligence.
To show you exactly what you will gain by replacing MR with Jet, we’ve compared specific features in three of our products (Jet Basics, Jet Reports and Jet Analytics) with the features you are currently using. Option 3: Jet Analytics. Jet Analytics. Data Warehouse and OLAP Cubes. Option 1: Jet Basics. Management Reporter.
More companies are turning to data analytics technology to improve efficiency, meet new milestones and gain a competitive edge in an increasingly globalized economy. One of the many ways that data analytics is shaping the business world has been with advances in business intelligence. For a beginner, it’s a lot in one place.
Tens of thousands of customers use Amazon Redshift to process exabytes of data every day to power their analytics workloads. In most analytic queries that use window functions, you may need to use those window functions in your WHERE clause as well. Ranjan Burman is an Analytics Specialist Solutions Architect at AWS.
Analytics Magazine notes that data lakes are among the most useful tools that an enterprise may have at its disposal when aiming to compete with competitors via innovation. Data lakes were designed to be agile and provide analytics data on the fly while processing incoming data at a remarkable speed.
For organizations considering a move to Microsoft Dynamics 365 Finance & Supply Chain Management (D365 F&SCM), or for those in the early stages of an implementation project, defining a clear strategy for curating data is a key to developing a comprehensive approach to reporting and analytics. What insightsoftware Brings to the Table.
TIBCO Jaspersoft offers a complete BI suite that includes reporting, online analytical processing (OLAP), visual analytics , and data integration. Online Analytical Processing (OLAP). JasperSoft for Big Data Analytics. Insights can also be shared externally with a single click. Source: [link] ]. At A Glance.
Named by Solutions Review as an Analytics Vendor to Watch, 2020. Named by CRN as a Top 10 Data Analytics Company to Watch. Expanded our support of Microsoft OLAP cube , an innovative open-source feat. Announced our metadata management automated solution support across the entire Microsoft BI Stack.
Also known as “analytics,” BI looks at more expansive data relationships, perhaps even between multiple systems that collect data (such as CRM and GP), and identifies trends that can inform strategic business decisions and objectives that will improve overall performance across the entire operation. Request a Free Personalized Demo.
The world of business analytics is evolving rapidly. Most organizations are looking for sophisticated reporting and analytics, but they have little appetite for managing the highly complicated infrastructure that goes with it. OLAP Cubes vs. Tabular Models. The first is an OLAP model.
The optimized data warehouse isn’t simply a number of relational databases cobbled together, however—it’s built on modern data storage structures such as the Online Analytical Processing (or OLAP) cubes. Cubes are multi-dimensional datasets that are optimized for analytical processing applications such as AI or BI solutions.
As the data visualization, big data, Hadoop, Spark and self-service hype gives way to IoT, AI and Machine Learning, I dug up an old parody post on the business intelligence market circa 2007-2009 when cloud analytics was just a disruptive idea. Thanks to The OLAP Report for lots of great market materials. OLAP for the masses, gents?
To handle such scenarios you need a transalytical graph database – a database engine that can deal with both frequent updates (OLTP workload) as well as with graph analytics (OLAP). If you want to solve interesting problems beyond basic data analytics, you are going to need formal semantics and that means schemas.
Key use cases Accelerate TDR with AI-powered unified analyst experience (UAX) QRadar Log Insights provides a simplified and unified analyst experience so your security operations team can visualize and perform analytics using all your security-related data, regardless of the location or the type of data source.
Executives increasingly rely on data and advanced analytics to make business decisions. This puts tremendous stress on the teams managing data warehouses, and they struggle to keep up with the demand for increasingly advanced analytic requests. Learn more about Jet Analytics and request a free demo today. Maintain Compliance.
With Jet Analytics from insightsoftware , users in the finance and accounting department can connect easily to Microsoft Dynamics data (and to other data sources) to get immediate access to all of the information they need for robust reporting and analysis. The Easy Path to BI. Those systems contain valuable information.
Amazon Redshift is a recommended service for online analytical processing (OLAP) workloads such as cloud data warehouses, data marts, and other analytical data stores. Amazon Redshift Serverless makes it straightforward to run and scale analytics in seconds without the need to set up and manage data warehouse clusters.
In this post, we share how Poshmark improved CX and accelerated revenue growth by using a real-time analytics solution. High-level challenge: The need for real-time analytics Previous efforts at Poshmark for improving CX through analytics were based on batch processing of analytics data and using it on a daily basis to improve CX.
Built from the bones of Dynamics AX, the cloud-based Dynamics 365 Finance & Operations (D365FO) has introduced some new out-of-the-box reporting and analytical capabilities to customers. What Jet Analytics Brings to the Table. With Jet Analytics, we provide an easy-to-setup pre-packaged set of data entities with our solution.
We organize all of the trending information in your field so you don't have to. Join 42,000+ users and stay up to date on the latest articles your peers are reading.
You know about us, now we want to get to know you!
Let's personalize your content
Let's get even more personalized
We recognize your account from another site in our network, please click 'Send Email' below to continue with verifying your account and setting a password.


Let's personalize your content