This site uses cookies to improve your experience. To help us insure we adhere to various privacy regulations, please select your country/region of residence. If you do not select a country, we will assume you are from the United States. Select your Cookie Settings or view our Privacy Policy and Terms of Use.
Cookie Settings
Cookies and similar technologies are used on this website for proper function of the website, for tracking performance analytics and for marketing purposes. We and some of our third-party providers may use cookie data for various purposes. Please review the cookie settings below and choose your preference.
Used for the proper function of the website
Used for monitoring website traffic and interactions
Cookie Settings
Cookies and similar technologies are used on this website for proper function of the website, for tracking performance analytics and for marketing purposes. We and some of our third-party providers may use cookie data for various purposes. Please review the cookie settings below and choose your preference.
Strictly Necessary: Used for the proper function of the website
Performance/Analytics: Used for monitoring website traffic and interactions
Onlineanalyticalprocessing is a computer method that enables users to retrieve and query data rapidly and carefully in order to study it from a variety of angles. OnlineAnalyticalProcessing (OLAP) is a term that refers to the process of analyzing data online. see more ).
The terms “reporting” and “analytics” are often used interchangeably. In fact there are some very important differences between the two, and understanding those distinctions can go a long way toward helping your organization make best use of both financial reporting and analytics. What About Financial Analytics?
OnlineAnalyticalProcessing (OLAP) is crucial in modern data-driven apps, acting as an abstraction layer connecting raw data to users for efficient analysis. Real-time OLAP Traditionally, OLAP datastores were designed for batch processing to serve internal business reports.
This post provides guidance on how to build scalable analytical solutions for gaming industry use cases using Amazon Redshift Serverless. The following diagram is a conceptual analytics data hub reference architecture. External processes are the spokes feeding data to and from the hub.
BI tools access and analyze data sets and present analytical findings in reports, summaries, dashboards, graphs, charts, and maps to provide users with detailed intelligence about the state of the business. Whereas BI studies historical data to guide business decision-making, business analytics is about looking forward.
This is where Business Analytics (BA) and Business Intelligence (BI) come in: both provide methods and tools for handling and making sense of the data at your disposal. So…what is the difference between business intelligence and business analytics? What Does “Business Analytics” Mean? What’s In a Name? Let’s take a closer look.
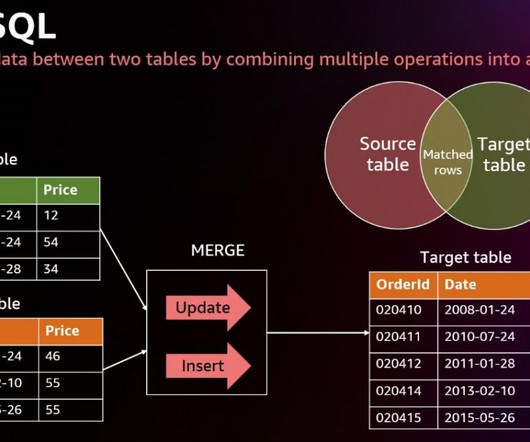
Tens of thousands of customers use Amazon Redshift to process exabytes of data every day to power their analytics workloads. To learn about authoring and running notebooks, refer to Authoring and running notebooks. For more details, refer to MERGE and QUALIFY clause.
Business intelligence (BI) software can help by combining onlineanalyticalprocessing (OLAP), location intelligence, enterprise reporting, and more. Outer detection is also sometimes referred to as Outlier Analysis or Outlier mining. Compare the Top 7 Microsoft Dynamics Business Intelligence and Analytics Platforms.
Microsoft referred to this approach as “bring your own database” (BYOD). Data warehouses gained momentum back in the early 1990s as companies dealing with growing volumes of data were seeking ways to make analytics faster and more accessible. This makes the process of getting started with Jet Analytics remarkably fast and easy.
The optimized data warehouse isn’t simply a number of relational databases cobbled together, however—it’s built on modern data storage structures such as the OnlineAnalyticalProcessing (or OLAP) cubes. Cubes are multi-dimensional datasets that are optimized for analyticalprocessing applications such as AI or BI solutions.
As data volumes continue to grow exponentially, traditional data warehousing solutions may struggle to keep up with the increasing demands for scalability, performance, and advanced analytics. For an example, refer to How JPMorgan Chase built a data mesh architecture to drive significant value to enhance their enterprise data platform.
Deriving business insights by identifying year-on-year sales growth is an example of an onlineanalyticalprocessing (OLAP) query. In our analytic use case, if we are analyzing quarterly growth rates, we may only need a couple of years’ worth of data; the rest can be unloaded into the data lake.
Redshift, like BigQuery and Snowflake, is a cloud-based distributed multi-parallel processing (MPP) database, built for big data sets and complex analytical workflows. First, we’ll dive into the two types of databases: OLAP (OnlineAnalyticalProcessing) and OLTP (Online Transaction Processing).
The optimized data warehouse isn’t simply a number of relational databases cobbled together, however—it’s built on modern data storage structures such as the OnlineAnalyticalProcessing (or OLAP) cubes. Cubes are multi-dimensional datasets that are optimized for analyticalprocessing applications such as AI or BI solutions.
We organize all of the trending information in your field so you don't have to. Join 42,000+ users and stay up to date on the latest articles your peers are reading.
You know about us, now we want to get to know you!
Let's personalize your content
Let's get even more personalized
We recognize your account from another site in our network, please click 'Send Email' below to continue with verifying your account and setting a password.
Let's personalize your content