This site uses cookies to improve your experience. To help us insure we adhere to various privacy regulations, please select your country/region of residence. If you do not select a country, we will assume you are from the United States. Select your Cookie Settings or view our Privacy Policy and Terms of Use.
Cookie Settings
Cookies and similar technologies are used on this website for proper function of the website, for tracking performance analytics and for marketing purposes. We and some of our third-party providers may use cookie data for various purposes. Please review the cookie settings below and choose your preference.
Used for the proper function of the website
Used for monitoring website traffic and interactions
Cookie Settings
Cookies and similar technologies are used on this website for proper function of the website, for tracking performance analytics and for marketing purposes. We and some of our third-party providers may use cookie data for various purposes. Please review the cookie settings below and choose your preference.
Strictly Necessary: Used for the proper function of the website
Performance/Analytics: Used for monitoring website traffic and interactions
Imagine if you could automate the tedious task of analyzing earnings reports, extracting key insights, and making informed recommendations—all without lifting a finger. You’ll learn how to set up and orchestrate three […] The post Building an Earnings Report Agent with Swarm Framework appeared first on Analytics Vidhya.
A multimodal report generator allows you to incorporate both text and images into a final output, making your reports more dynamic and visually rich. In many real-world applications, data is not purely textualit may include images, tables, and charts that help reinforce the narrative.
What is equally important here is the ability to communicate the data and insights from your predictive models through reports and dashboards. The post Building your First Power BI Report from Scratch appeared first on Analytics Vidhya. And […].
Introduction In business, financial analysis and reporting are critical for strategic decision-making and operational oversight. Traditionally, financial reporting and analysis have been time-consuming, requiring expertise to interpret complex data and generate actionable business intelligence.
Organizations look to embedded analytics to provide greater self-service for users, introduce AI capabilities, offer better insight into data, and provide customizable dashboards that present data in a visually pleasing, easy-to-access format.
In line with the latest World Happiness Report, it is evident that being happy has become a worldwide priority. The World Happiness Report rates happiness on six indicators: positive emotions, […] The post Analysing World Happiness Report (2020-2022) appeared first on Analytics Vidhya.
The post Generate Reports Using Pandas Profiling, Deploy Using Streamlit appeared first on Analytics Vidhya. ArticleVideo Book This article was published as a part of the Data Science Blogathon Introduction Pandas library offers a wide range of functions.
The post Reproducible ML Reports Using YAML Configs (with codes) appeared first on Analytics Vidhya. ArticleVideo Book This article was published as a part of the Data Science Blogathon Research is to see what everybody else has seen and to.
Not only are you responsible for the ongoing financial strategy of your organization, but you’re probably expected to provide timely, accurate reports to a variety of stakeholders. CFO dashboards exist to enhance the strategic as well as the analytical efforts related to every financial aspect of your business. Let’s get started.
Embedding dashboards, reports and analytics in your application presents unique opportunities and poses unique challenges. We interviewed 16 experts across business intelligence, UI/UX, security and more to find out what it takes to build an application with analytics at its core.
Despite all the advances organizations have made with respect to analytics, our most recent research shows the majority of the workforce in the majority of organizations are not using analytics and business intelligence (BI). Less than one-quarter (23%) report that one-half or more of their workforce is using analytics and BI.
The post A Case Study: Superstore Sales & Profit Report Using Power BI appeared first on Analytics Vidhya. The data generated from the above sources can […].
Whether you manage a big or small company, business reports must be incorporated to establish goals, track operations, and strategy, to get an in-depth view of the overall company state. And business report templates are the best help for that. Your Chance: Want to test professional business reporting software?
The rise of self-service analytics democratized the data product chain. Suddenly advanced analytics wasn’t just for the analysts. Businesses of all sizes are no longer asking if they need increased access to business intelligence analytics but what is the best BI solution for their specific business.
Every data-driven project calls for a review of your data architecture—and that includes embedded analytics. Before you add new dashboards and reports to your application, you need to evaluate your data architecture with analytics in mind. Expert guidelines for a high-performance, analytics-ready modern data architecture.
Organizations are converting them to cloud-based technologies for the convenience of data collecting, reporting, and analysis. It provides the necessary foundation for businesses to […] The post Important Keras Questions for Cracking Analytics Interviews appeared first on Analytics Vidhya.
In my past perspectives, I’ve written about the evolution from data at rest to data in motion and the fact that you can’t rely on dashboards for real-time analytics. As well, analytics are becoming more and more intertwined with operations. If organizations can’t rely on dashboards for real-time analytics, what should they consider?
Table of Contents 1) What Is A Performance Report? 2) The Importance of Performance Reports 3) Performance Report Examples 4) Performance Reporting Tips Performance reporting has been a traditional business practice for decades now. At the time, this was not an issue, as the static nature of reporting was the norm.
Organizations of all sizes are dealing with exponentially increasing data volume and data sources, which creates challenges such as siloed information, increased technical complexities across various systems and slow reporting of important business metrics.
But many companies fail to achieve this goal because they struggle to provide the reporting and analytics users have come to expect. The Definitive Guide to Embedded Analytics is designed to answer any and all questions you have about the topic. It will show you what embedded analytics are and how they can help your company.
Marketing invests heavily in multi-level campaigns, primarily driven by data analytics. This analytics function is so crucial to product success that the data team often reports directly into sales and marketing. Figure 3: The vast and varied types of analytics required during the launch phase. DataOps Success Story.
Their business unit colleagues ask an endless stream of urgent questions that require analytic insights. Business analysts must rapidly deliver value and simultaneously manage fragile and error-prone analytics production pipelines. In business analytics, fire-fighting and stress are common. Analytics Hub and Spoke.
1) What Is Business Intelligence And Analytics? If someone puts you on the spot, could you tell him/her what the difference between business intelligence and analytics is? We already saw earlier this year the benefits of Business Intelligence and Business Analytics. What Is Business Intelligence And Analytics?
According to Allied Market Research’s Report, the AI in the video games market alone […] The post Make Your Own Video Game in 7 Easy Steps! appeared first on Analytics Vidhya. AI is projected to contribute over $15.7 trillion to the global economy by 2030, and the gaming industry is an integral part of this growth.
In the rapidly-evolving world of embedded analytics and business intelligence, one important question has emerged at the forefront: How can you leverage artificial intelligence (AI) to enhance your application’s analytics capabilities? Infusing advanced AI features into reports and analytics can set you apart from the competition.
Table of Contents 1) What Is The Report Definition? 2) Top 14 Types Of Reports 3) What Does A Report Look Like? Businesses have been producing reports since, forever. This presents a problem for many modern organizations today as building reports can take from hours to days. What Is The Report Definition?
It focuses on creating a chatbot that can understand medical reports uploaded by users and give answers based on the […] The post Building a Multi-Vector Chatbot with LangChain, Milvus, and Cohere appeared first on Analytics Vidhya. This article explains how to build a medical chatbot that uses multiple vectorstores.
Introduction Organizations are turning to cloud-based technology for efficient data collecting, reporting, and analysis in today’s fast-changing business environment. Data and analytics have become critical for firms to remain competitive.
Overview A demonstration of statistical analytics by Integrating Python within Power BI Share the findings using dashboards and reports Introduction Power BI is. The post Integrating Python in Power BI: Get the best of both worlds appeared first on Analytics Vidhya.
The complexity of healthcare data, the need for real-time analytics, and the demand for user-friendly interfaces can often seem overwhelming. But with Logi Symphony, these challenges become opportunities.
Google Analytics 4 (GA4) provides valuable insights into user behavior across websites and apps. In this post, we show you how to establish the data ingestion pipeline between Google Analytics 4, Google Sheets, and an Amazon Redshift Serverless workgroup. Create a report on Google Analytics. This post has two parts.
This week on the keynote stages at AWS re:Invent 2024, you heard from Matt Garman, CEO, AWS, and Swami Sivasubramanian, VP of AI and Data, AWS, speak about the next generation of Amazon SageMaker , the center for all of your data, analytics, and AI. The relationship between analytics and AI is rapidly evolving.
This blog dives into the remarkable journey of a data team that achieved unparalleled efficiency using DataOps principles and software that transformed their analytics and data teams into a hyper-efficient powerhouse. This team built data assets with best-in-class productivity and quality through an iterative, automated approach.
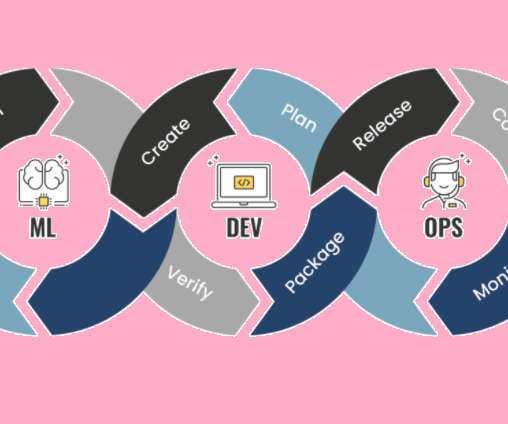
This article was published as a part of the Data Science Blogathon Introduction According to a report, 55% of businesses have never used a machine learning model before. The post MLOPs Operations: A beginner’s Guide | Python appeared first on Analytics Vidhya.
This report is designed to help readers select an embedded analytics product. It provides 12 criteria to consider when evaluating embedded capabilities. It also comes with a companion spreadsheet that enables users to score and compare products along these 12 dimensions and others they may add.
These data sets create shareable reports, dashboards, and apps for data visualization, evaluation, […]. The post Understand the Workings of Power BI appeared first on Analytics Vidhya. Data from many sources are combined into a single dataset in this cloud-based platform.
A recent report by McKinsey suggests that the impact of gen AI on productivity could add trillions of dollars in value annually across various industries and sectors. Trillion Annually: McKinsey appeared first on Analytics Vidhya.
According to a recent report by Goldman Sachs, implementing Artificial Intelligence (AI) could increase the global GDP by 7%. The report states that as AI tools that use Natural Language Processing (NLP) continue to be integrated into businesses and society, they could help to drive up to $7 trillion in additional global GDP growth.
3) The Link Between White Label BI & Embedded Analytics 4) An Embedded BI Workflow Example 5) White Labeled Embedded BI Examples In the modern world of business, data holds the key to success. That said, data and analytics are only valuable if you know how to use them to your advantage. What Is White Label Business Intelligence?
Discover which features will differentiate your application and maximize the ROI of your embedded analytics. Brought to you by Logi Analytics. But today, dashboards and visualizations have become table stakes.
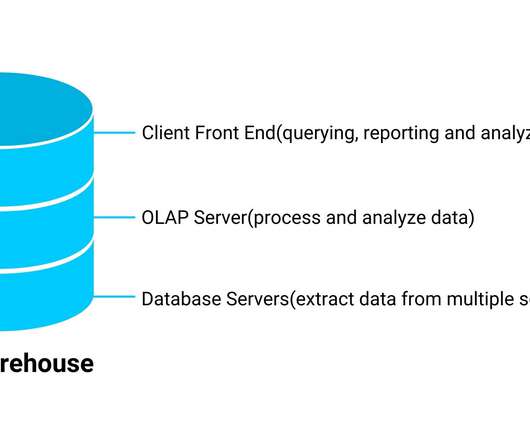
Introduction All data mining repositories have a similar purpose: to onboard data for reporting intents, analysis purposes, and delivering insights. The post Data Warehouses, Data Marts and Data Lakes appeared first on Analytics Vidhya. By their definition, the types of data it stores and how it can be accessible to users differ.
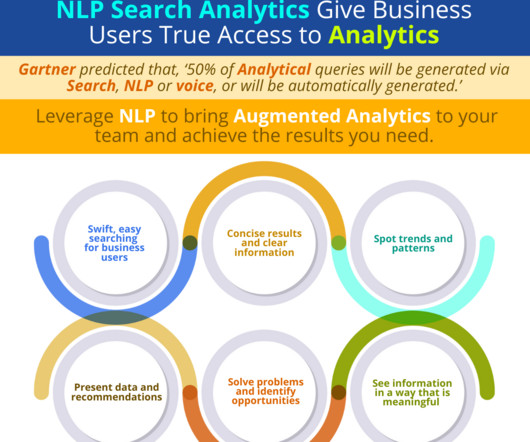
NLP Search Analytics Ensures User Adoption! NLP search technology significantly simplifies the user experience and encourages team members to learn and incorporate augmented analytics into their daily activities.’ These days, most people understand the term Natural Language Processing (NLP). Today, this prediction is a reality.
Hypothesis testing is used to look if there is any significant relationship, and we report it using a p-value. The post Statistical Effect Size and Python Implementation appeared first on Analytics Vidhya. Introduction One of the most important applications of Statistics is looking into how two or more variables relate.
The proposed model illustrates the data management practice through five functional pillars: Data platform; data engineering; analytics and reporting; data science and AI; and data governance. However, the analytics/reporting function needs to drive the organization of the reports and self-service analytics.
Logi Symphony offers a powerful and user-friendly solution, allowing you to seamlessly embed self-service analytics, generative AI, data visualization, and pixel-perfect reporting directly into your applications. Traditional BI tools can be cumbersome and difficult to integrate - but it doesn't have to be this way.
We organize all of the trending information in your field so you don't have to. Join 42,000+ users and stay up to date on the latest articles your peers are reading.
You know about us, now we want to get to know you!
Let's personalize your content
Let's get even more personalized
We recognize your account from another site in our network, please click 'Send Email' below to continue with verifying your account and setting a password.


Let's personalize your content