This site uses cookies to improve your experience. To help us insure we adhere to various privacy regulations, please select your country/region of residence. If you do not select a country, we will assume you are from the United States. Select your Cookie Settings or view our Privacy Policy and Terms of Use.
Cookie Settings
Cookies and similar technologies are used on this website for proper function of the website, for tracking performance analytics and for marketing purposes. We and some of our third-party providers may use cookie data for various purposes. Please review the cookie settings below and choose your preference.
Used for the proper function of the website
Used for monitoring website traffic and interactions
Cookie Settings
Cookies and similar technologies are used on this website for proper function of the website, for tracking performance analytics and for marketing purposes. We and some of our third-party providers may use cookie data for various purposes. Please review the cookie settings below and choose your preference.
Strictly Necessary: Used for the proper function of the website
Performance/Analytics: Used for monitoring website traffic and interactions
This article was published as a part of the Data Science Blogathon. Overview In this article, we will be dealing with Walmart’s sales dataset and will follow all the data analysis steps on the same and as a result, will try to get some business-related insights from the operations we will be performing on this dataset. […].
This article was published as a part of the Data Science Blogathon. Microsoft‘s businessanalytics product, Power BI, delivers interactive data visualization BI capabilities that allow users to see and share data and insights throughout their organisation. What is Power BI?
This article was published as a part of the Data Science Blogathon. Explore the simple path to become a great visual data storyteller Are. The post A Quick Guide to Become a Data Analyst appeared first on Analytics Vidhya.
Over the past decade, business intelligence has been revolutionized. Spreadsheets finally took a backseat to actionable and insightful data visualizations and interactive business dashboards. The rise of self-service analytics democratized the data product chain. Suddenly advanced analytics wasn’t just for the analysts.
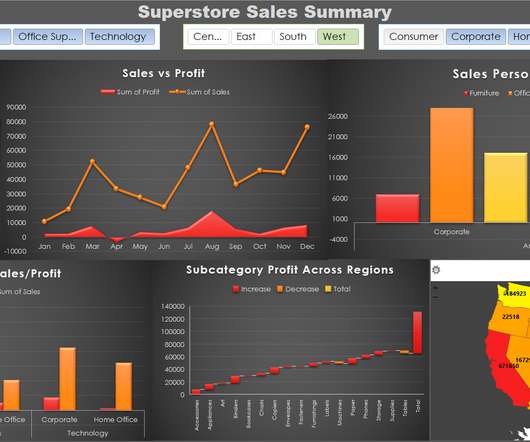
This article was published as a part of the Data Science Blogathon Introduction I have been using Pandas with Python and Plotly to create some of the most stunning dashboards for my projects. In recent times, I have switched to learning Excel as it was a prerequisite in every company I had to apply to. I […].
We have written about management reporting methods that can be utilized in the modern practice of creating powerful analysis, bringing complex data into simple visuals, and employ them to make actionable decisions. Your Chance: Want to visualize & track operational metrics with ease? How To Select Operational Metrics And KPIs?
We already saw earlier this year the benefits of Business Intelligence and BusinessAnalytics. Try our professional BI and analytics software for 14 days free! What’s the difference between BusinessAnalytics and Business Intelligence? What Do The Experts Say? Confused yet?
This article was published as a part of the Data Science Blogathon. Introduction Data and Information about a Customer are important for all businesses and companies. For a business to be data-driven, a Company needs to be highly data-driven and focus highly on customer analytics. It […].
This article proposes a methodology for organizations to implement a modern data management function that can be tailored to meet their unique needs. The data platform function will set up the reporting and visualization tools, while the data engineering function will centralize the curated data.
Through the art of streamlined visual communication, data dashboards permit businesses to engage in real-time and informed decision-making and are key instruments in data interpretation. For a more in-depth review of scales of measurement, read our article on data analysis questions. There is always an arbitrary zero point.
Introduction This article will introduce the concept of data modeling, a crucial process that outlines how data is stored, organized, and accessed within a database or data system. It involves converting real-world business needs into a logical and structured format that can be realized in a database or data warehouse.
BI users analyze and present data in the form of dashboards and various types of reports to visualize complex information in an easier, more approachable way. Business intelligence can also be referred to as “descriptive analytics”, as it only shows past and current state: it doesn’t say what to do, but what is or was.
Real time BI is the application of analytics and data processing tools to gain insight into relevant data and visualizations as they’re created. That way businesses remain responsive and adaptable in an ever-changing digital environment. Download our executive, pocket-sized guide to real time BI and analytics!
To put the power of business intelligence into perspective, here are 4 key insights you should know: Businesses using analytics are five times more likely to make better, quicker decisions, according to an article published on BetterBuys. By 2025, the global BI and analytics market is expected to soar to a worth of $147.19
A BI dashboard — or business intelligence dashboard — is an information management tool that uses data visualization to display KPIs (key performance indicators) tracked by a business to assess various aspects of performance while generating actionable insights. Advanced businessanalytics tools come in all shapes and sizes.
However, if someone puts you on the spot, can you clearly tell the difference between business intelligence and analytics? This article will discuss the definition of business intelligence and analytics and the difference between them. BusinessAnalytics. Data visualization with FineReport.
When encouraging these BI best practices what we are really doing is advocating for agile business intelligence and analytics. Through agile adoption, organizations are seeing a quicker return on their BI investments and are able to quickly adapt to changing business needs.
Benefits Of White Label Business Intelligence As mentioned above, the key benefit of using white label BI is being able to fully customize the look and feel of a third-party BI application. We are talking about logos, colors, fonts, buttons, visualizations, and many other elements that make this an invaluable technology.
The best business intelligence strategy lays out these resources in the beginning, with additional wiggle room. Rely on interactive data visualizations. For decades now, data analytics has been considered a segregated task. How To Create A Business Intelligence Strategy. Employ a Chief Data Officer (CDO).
An article titled “ The Big Business of Big Data ” examines some of the possibilities. One of our big data analytics examples is that of Tropical Smoothie Cafe. It does this by using Artwork Visual Analysis (AVA) “a collection of tools and algorithms designed to surface high-quality imagery from videos. Behind the scenes.
Dashboard reporting refers to putting the relevant business metrics and KPIs in one interface, presenting them visually, dynamic, and in real-time, in the dashboard formats. This article will review the best 10 dashboard tools covering different areas, including open source and free software. FineReport. Query2Report.
Why Are Restaurant Analytics Important? Businessanalytics for restaurants is integral to understanding the inner workings of your business but and being aware of how you can improve it to foster a sustainable level of success that will set you apart from the competition. What holiday business is like.
This article provides a brief explanation of the SVM Classification method of analytics. How Can SVM Classification Analysis Benefit BusinessAnalytics? Let’s examine two business use cases where SVM Classification can benefit the organization. What is SVM Classification Analysis? Use Case – 1.
BI software assists businesses with data display and analytics to help companies discover the situations, market challenges, as well as the chance. In this article, I compared the top 5 BI tools of 2019 based on the overall ease-of-use, BI features, and the price. Pro: Stunning Data Visualization . From Google.
In my sixth year of self-employment, the demand for data visualization skills is stronger than ever. This training program is about classic data visualization principles? advanced techniques like applying data visualization principles to reports, slideshows, infographics, and dashboards. What’s Included. We’ll go broad?
Talk to any business colleague or pick up any technology analyst article and you will find plenty of discussion about the current use of data analytics tools and impressive predictions about the growth of this market. Data Analytics is not just for data scientists! There is a reason for that popularity and growth!
However, if someone puts you on the spot, can you clearly tell the difference between business intelligence and analytics? This article will discuss the definition of business intelligence and analytics and the difference between them. BusinessAnalytics. Data visualization with FineReport.
Consider the ubiquitous nature of Google-type searches and how the concept of natural language processing (NLP) and tools that allow users to ask questions and get answers easily can be applied to your businessanalytics. One of the greatest obstacles to self-serve analytics is the need for a specialized skill set to use the solution.
Companies and governments are turning to analytics to navigate these troubled waters. There are many ways analytics and data will help the world overcome this crisis. In this article, we’ll focus on using Social Network Analysis to help companies understand their workforce and respond to coronavirus cases that hit close to home.
Posting articles in the series will be sporadic, and 2. This brings me to the subject of this post: Paginated and Analytic reports. Writing this blog series while juggling other commitments has brought me to two realizations: 1.
This is a summary article. Building a data-driven business includes choosing the right software and implementing best practices around its use. Our Business Perspectives help you make smarter decisions no matter where you are in your analytics journey. Read the complete company’s BI budget guide here.
Organizations are now turning to digital innovations such as AI-infused analytics platforms to enhance and grow the knowledge of their teams and talent. A recent study by Learning Pool revealed 76% of mature metrics practices are enabled by technology that integrates data from multiple sources.
With the advent of Business Intelligence Dashboard (BI Dashboard), access to information is no longer limited to IT departments. Every user can now create interactive reports and utilize data visualization to disseminate knowledge to both internal and external stakeholders.
This article explores the data analyst job description, covering essential skills, tools, education, certifications, and experience. They analyze, interpret, and manipulate complex data, track key performance indicators, and present insights to management through reports and visualizations.
This article looks at the ARIMAX Forecasting method of analysis and how it can be used for business analysis. For more information about data trend and pattern analysis techniques, read our article entitled, ‘ What Are Data Trends and Patterns, and How Do They Impact Business Decisions?’
This article provides a brief explanation of the ARIMA method of analytical forecasting. This analytical forecasting method is suitable for instances when data is stationary/non stationary and is univariate, with any type of data pattern, i.e., level/trend/seasonality/cyclicity. What is ARIMA Forecasting?
This article provides a brief explanation of the KMeans Clustering algorithm. Business Benefit: The business marketing team can focus on risky customer segments in an efficient way in order to avoid losing those customers. What is the KMeans Clustering algorithm? KMeans Clustering is a grouping of similar things or data.
In this article, we will focus on the identification and exploration of data patterns and the trends that data reveals. The business can use this information for forecasting and planning, and to test theories and strategies. In this article, we have reviewed and explained the types of trend and pattern analysis.
This article provides a brief explanation of the Holt-Winters Forecasting model and its application in the business environment. For more information about data trend and pattern analysis techniques, read our article entitled, ‘ What Are Data Trends and Patterns, and How Do They Impact Business Decisions?’
This article explains the Karl Pearson Correlation method of analysis, and how it can be applied in business. What is the Karl Pearson Correlation Analytical Technique? Correlation is a statistical measure that indicates the extent to which two variables fluctuate together.
This article describes the Simple Linear Regression method of analysis. This method helps a business to identify the relationship between X and Y and the nature and direction of that relationship. What is Simple Linear Regression?
This article presents a brief explanation of Outliers, and how this type of analysis is used. The Smarten approach to business intelligence and businessanalytics focuses on the business user and provides Advanced Data Discovery so users can perform early prototyping and test hypotheses without the skills of a data scientist.
This article discusses the analytical method of Hierarchical Clustering and how it can be used within an organization for analytical purposes. What is Hierarchical Clustering?
This article describes the analytical technique of multiple linear regression. The Smarten approach to business intelligence and businessanalytics focuses on the business user and provides Advanced Data Discovery so users can perform early prototyping and test hypotheses without the skills of a data scientist.
We organize all of the trending information in your field so you don't have to. Join 42,000+ users and stay up to date on the latest articles your peers are reading.
You know about us, now we want to get to know you!
Let's personalize your content
Let's get even more personalized
We recognize your account from another site in our network, please click 'Send Email' below to continue with verifying your account and setting a password.


Let's personalize your content