This site uses cookies to improve your experience. To help us insure we adhere to various privacy regulations, please select your country/region of residence. If you do not select a country, we will assume you are from the United States. Select your Cookie Settings or view our Privacy Policy and Terms of Use.
Cookie Settings
Cookies and similar technologies are used on this website for proper function of the website, for tracking performance analytics and for marketing purposes. We and some of our third-party providers may use cookie data for various purposes. Please review the cookie settings below and choose your preference.
Used for the proper function of the website
Used for monitoring website traffic and interactions
Cookie Settings
Cookies and similar technologies are used on this website for proper function of the website, for tracking performance analytics and for marketing purposes. We and some of our third-party providers may use cookie data for various purposes. Please review the cookie settings below and choose your preference.
Strictly Necessary: Used for the proper function of the website
Performance/Analytics: Used for monitoring website traffic and interactions
The answer is modern agency analytics reports and interactive dashboards. In this article, we will cover every fundamental aspect to take advantage of agency analytics. Starting with its definition, following with the benefits of agency reports, a list of tools, and a set of agency dashboard examples. What Are Agency Analytics?
Soon businesses of all sizes will have so much amount of information that dashboard software will be the most invaluable resource a company can have. That’s why we welcome you to the world of interactive dashboards. Your Chance: Want to test interactive dashboard software for free? What Is An Interactive Dashboard?
2) What Is A Content Dashboard? 4) Content Dashboards Examples. Modern content performance reports in the shape of an interactive online dashboard present an intuitive and accessible way to assess your content’s success and its ROI in real-time and in one centralized location. What Is A Content Dashboard?
A chief technology officer (also referred to as chief technical officer or chief technologist), has an immense responsibility to drive a company forward and lead the technological advancements, research, development, and management in order to generate business value and increase the return on investment (ROI). What Is A CTO Dashboard?
An online BI dashboard. Thanks to specific business intelligence best practices for dashboard design. Exclusive Bonus Content: Download Our Free Dashboard Checklist! Get the free guide with great tips for your dashboard implementation! What Is The Definition Of A BI Dashboard? How can you create one?
Visual marketing dashboards are prime examples of using big data effectively in marketing. In this day and age, all businesses must pay especially close consideration to the performance of their marketing metrics dashboard. In this article, we will discuss what l needs to be included in marketing reporting dashboards.
If you want to convey crucial information to decision-makers in the easiest and most effective way possible, you need to embrace the power of interactive dashboards. A business dashboard offers at-a-glance insights based on key performance indicators (KPIs) and is an intuitive and visually pleasing way to consume data.
Like most digital marketing mediums, there are a number of KPI examples you can associate with these platforms – and if tracked, measured, and analyzed to their maximum capacity, social KPIs will help your business expand its commercial reach while increasing engagement, boosting revenue, and significantly improving your ROI.
By the end of this article, making stunning and useful managerial reports will be second nature to you. When these reports are backed up with powerful visualizations developed with a dashboard creator , no information can stay hidden, eliminating thus the possibility of human errors and negative business impact.
Finally, we will show how to combine those metrics with the help of modern KPI software and create professional supply chain dashboards. Every business, regardless of service, product, or sector strives to achieve the best return on investment (ROI) for each and every commercial activity it undertakes. Return Reason.
In this article, we will detail everything which is at stake when we talk about DQM: why it is essential, how to measure data quality, the pillars of good quality management, and some data quality control techniques. More generally, low-quality data can impact productivity, bottom line, and overall ROI. 3 – Defining data quality.
Below, in the article, we’ve gathered some of the marketing reports templates that can easily be used to perfect the efficiency of generating data and reduce the time needed to create it. As a Forbes article states , “there’s no such thing as ‘set it and forget it’ [in digital marketing]”. Use professional software.
Dashboard reporting refers to putting the relevant business metrics and KPIs in one interface, presenting them visually, dynamic, and in real-time, in the dashboard formats. This article will review the best 10 dashboard tools covering different areas, including open source and free software. What Makes a Great Dashboard?
6) The Use of Dashboards For Data Interpretation. Business dashboards are the digital age tools for big data. Through the art of streamlined visual communication, data dashboards permit businesses to engage in real-time and informed decision-making and are key instruments in data interpretation. 2) How To Interpret Data?
Ad hoc reporting, also known as one-time ad hoc reports, helps its users to answer critical business questions immediately by creating an autonomous report, without the need to wait for standard analysis with the help of real-time data and dynamic dashboards. Easy to use: .
Moreover, a business intelligence strategy with visualization capabilities boasts a ROI of $13.01 Data visualizations put together in intuitive dashboards can make the analysis process more dynamic and understandable while keeping the audience engaged. However, this is no longer the case thanks to modern dashboard technology.
In this article, we will explain the basic definition of procurement reports, talk about the benefits and challenges that occur when dealing with procurement data to provide you with innovative ideas on spotting inefficiencies. We will see this in our procurement report sample below in the article. e) Take accurate measurements.
But the rewards outperform by far its costs, and it is well known that business intelligence ROI is real even if it is sometimes hard to quantify. million to American businesses only, as it impacts the bottom-line, the productivity, and ultimately the overall ROI. Let’s see this with an example of a sales dashboard.
That said, in this article, we will go through both agile analytics and BI starting from basic definitions, and continuing with methodologies, tips, and tricks to help you implement these processes and give you a clear overview of how to use them. During this stage, you: Operate and support the system, dashboards, and reports.
For example, in regards to marketing, traditional advertising methods of spending large amounts of money on TV, radio, and print ads without measuring ROI aren’t working like they used to. Renowned author Bernard Marr wrote an insightful article about Shell’s journey to become a fully data-driven company.
Several marketing dashboard tools allow you to generate automated online dashboards and reports to track your most relevant KPIs in one place. Later, your team can find the right channels that offer better ROI. Maintaining and increasing the ROI of your digital marketing requires constant improvement and iteration.
In addition, we will see how online dashboards have overthrown the static nature of classic reports and given way to a much faster, more interactive way of working with data. Here we will cover 15 useful dashboard examples from different industries and functions to put the value of dashboard reporting into perspective.
A few saved orders are often all it takes to get into positive ROI territory based on increased labor costs. Order tools such as a modern logistics dashboard often allow you to track returns, replacements, and refunds. Increasing the number of scans can likely reduce your error rate by single-digit to double-digit percentages.
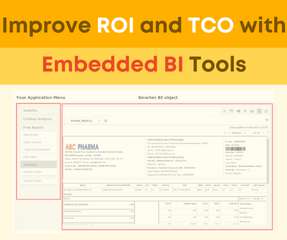
Embedded BI Improves ROI and TCO for Existing Technology and Benefits Business Users! One of the often-overlooked advantages of this strategy is the improvement of return on investment (ROI) and total cost of ownership (TCO).
You have to work harder to get a high ROI with social media advertising than with organic content, because you have to spend money on ads. These data analytics platforms make it easier to improve the ROI of your strategy. You may want to review that article for more insights. Content marketing. Email marketing. Remarketing.
Today, employee output is no longer represented by vague descriptions, but by isolated figures that offer insight for improvement in specific areas, which can be found on an HR dashboard. You can dig deeper into this topic by looking at our HR reports article gathering examples and templates. Let’s look at some of them.
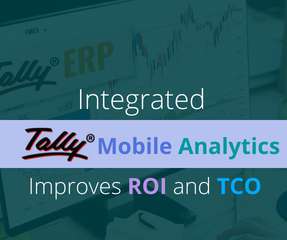
Increase the ROI and TCO of Tally ERP with Integrated Tally Mobile Analytics! If you are considering, or have already purchased software, you probably faced the questions from your management team about return on investment (ROI) and total cost of ownership (TCO). On the surface, the calculations for TCO and ROI may seem simple.
In this article, you’ll discover: upcoming trends in business intelligence what benefits will BI provide for businesses in 2020 and on? Increase in ROI. interactive reports, dashboards, timesheets flexibility in creating data apps user-friendly search for data trends integration with third-parties profound search feature.
This is where the significance of a financial dashboard shines through. In this article, we will explore the concept of a financial dashboard, highlight its numerous benefits, and provide various kinds of financial dashboard examples for you to employ and explore. What is A Financial Dashboard?
In today’s data-driven landscape, businesses are leaning more on BI tools , particularly BI dashboard solutions, to enhance decision-making through data visualization. These BI Dashboard tools blend advanced analytics with user-friendly interfaces, revealing invaluable insights.
This article will delve into this in more detail. This article will discuss everything you need to know about Instagram stories for business and how to use analytics to maximize your ROI: What are Instagram Stories for business? Instagram marketing is one of the areas that can be highly dependent on analytics technology.
With a new year on the horizon, in this article, we’ll explore 10 essential SaaS trends that will stand out in 2020. Moreover, more employees than ever feel empowered to perform their jobs better by being able to work with dynamic mobile dashboards and various tools. 2019 was a breakthrough year for the SaaS world in many ways.
Additionally, Deloittes ESG Trends Report highlights fragmented ESG data, inconsistent reporting frameworks and difficulties in measuring sustainability ROI as primary challenges preventing organizations from fully leveraging their data for ESG initiatives. This article was made possible by our partnership with the IASA Chief Architect Forum.
In this article, we’ll show key considerations for selecting the right machine learning framework for your project and briefly review four popular ML frameworks. Algorithms have parameters, which you can think of as a dashboard with switches and dials that control how the algorithm operates.
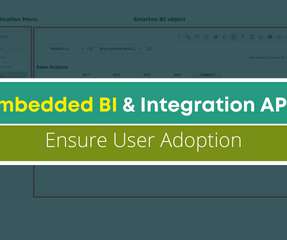
SO…when considering options for business intelligence and augmented analytics, your business must satisfy the needs and expectations of your team, or it risks investing in products and solutions that will reap poor return on investment (ROI), poor total cost of ownership (TCO) and poor user adoption.
You may have seen many articles emphasize how to improve the layout of the report. e.g., If you focus on user growth, you can sort through the user categories, the key metrics of each AARRR phases, the results of products or operational activities related to user growth, ROIs, and so on. The Basics of Report Designing . From Google.
You can use their sophisticated analytics dashboard to improve your marketing strategies. Consequently, this article discusses six targeting options on LinkedIn and how you can use them to drive better results in your campaign strategy. Data analytics technology can make it a lot easier to get a high ROI from your LinkedIn Ads.
Types of marketing reports How to write a marketing report/dashboard? A similar idea is the marketing dashboard. Marketing Report(Dashboard) Template- from FineReport. The templates and examples used in this article are made by FineReport. You can try various built-in report and dashboard templates for free!
With the right tools and strategy, your enterprise can implement analytics, democratize data and improve data literacy, assuring user adoption and a significant return on investment (ROI) and low total cost of ownership (TCO). But that doesn’t have to be you! There are numerous reasons for poor user adoption.
The Use and Benefits of Low-Code No-Code Development in Business Intelligence (BI) and Predictive Analytics Solutions Introduction In this article, we will discuss Low-Code and No-Code Development (LCNC) and the use of the Low Code and No Code approach for business intelligence (BI) tools and predictive analytics solutions.
This article will introduce the top 10 types of reports , with the reporting examples and process of reports designing, to help you choose the right report to support your decision. This kind of report also can be called a dashboard. Reports are the basic business requirements of an enterprise. Top 10 Types of Report. Detail Report.
This article shows you a comprehensive guide on Financial Reporting and Financial Analysis and illustrates how to use them appropriately. . This article provides four ideas for reference. Dupont Analysis Dashboard. The financial index analysis dashboard opens a window into company’s comprehensive financial standing.
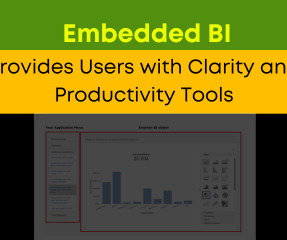
Embedded BI Goes Beyond Technology ROI to Improve Clarity, Agility and Productivity! Enterprise Strategy Group reports that embedded analytics can provide 50% lower upfront development costs and 83% lower support costs, thereby improving return on investment (ROI). It isn’t possible to anticipate every need.
Increasing ROI for the business requires a strategic understanding of — and the ability to clearly identify — where and how organizations win with data. Data integration points occur with data-in-motion in memory/data caches and dashboards that impact real-time decisioning and customer experiences.
We organize all of the trending information in your field so you don't have to. Join 42,000+ users and stay up to date on the latest articles your peers are reading.
You know about us, now we want to get to know you!
Let's personalize your content
Let's get even more personalized
We recognize your account from another site in our network, please click 'Send Email' below to continue with verifying your account and setting a password.


Let's personalize your content