This site uses cookies to improve your experience. To help us insure we adhere to various privacy regulations, please select your country/region of residence. If you do not select a country, we will assume you are from the United States. Select your Cookie Settings or view our Privacy Policy and Terms of Use.
Cookie Settings
Cookies and similar technologies are used on this website for proper function of the website, for tracking performance analytics and for marketing purposes. We and some of our third-party providers may use cookie data for various purposes. Please review the cookie settings below and choose your preference.
Used for the proper function of the website
Used for monitoring website traffic and interactions
Cookie Settings
Cookies and similar technologies are used on this website for proper function of the website, for tracking performance analytics and for marketing purposes. We and some of our third-party providers may use cookie data for various purposes. Please review the cookie settings below and choose your preference.
Strictly Necessary: Used for the proper function of the website
Performance/Analytics: Used for monitoring website traffic and interactions
Gathering data and information from one or multiple platforms and creating a comprehensive social media dashboard is equally important as creating the social content itself. Here we will present a social media dashboard definition, a guide on how to create one, and finalize with social media dashboard templates at the end of the article.
As important parts of business intelligence, scorecard and dashboard can both play an obvious role in promoting enterprise development. However, limited by factors such as cost and corporate strategies, sometimes companies need to make a choice between scorecard vs dashboard. Definition of scorecard and dashboard.
As important parts of business intelligence, scorecards and dashboards can both play an obvious role in promoting enterprise performance management. However, many users are confused with the difference between scorecard vs. dashboard. This article aims to provide a reference for the choice of enterprises.
Whatever your sector or niche, if you want to remain adaptable and get one step ahead of the competition, working with the right data-driven tools and utilizing a corporate dashboard is essential. That’s where corporate dashboards come in. Your Chance: Want to create your own dynamic corporate dashboard? 1) CFO dashboard.
An extraordinary amount of time, effort, $$$ are spent on building dashboards/scorecards for CMOs… Yet, the end result, nearly always, is a useless data puke. CMO dashboards end up being useless when capabilities exceed needs. Personal Bias: I prefer the word Scorecard over Dashboard. Easy existence.
In the matter, data analysis and dashboard designer software is a precious ally. In this article, we will take a closer look at the inventory management: what are the performance indicator that can help, how to choose them, and outline some inventory metrics examples as well as best practices. click to enlarge**. click to enlarge**.
In addition, we will see how online dashboards have overthrown the static nature of classic reports and given way to a much faster, more interactive way of working with data. A good example is a KPI scorecard. Let’s get started with a brief report definition.
Several marketing dashboard tools allow you to generate automated online dashboards and reports to track your most relevant KPIs in one place. The image above is an example of a scorecard report tracking the performance of 4 social channels. The value of this tool lies in its visual nature.
Moreover, BI platform allows users to customize dashboards, create beautiful data visualizations, build scorecards, and compare them with key performance indicators (KPIs). The examples of BI reports in this article are all built-in templates made by FineReport. BI Platform Interface (by FineReport). Free Download. FineReport.
With the introduction of Artificial Intelligence and Machine Learning, as well as data visualization tools, designed for charting, dashboards and performance scorecards. In this article, we will discuss some of the primary considerations for features and functionality, support, upgrades, technology, etc.,
OBIEE is a strategic BI tool that provides a web platform with attractive dashboards suitable for C-level needs. Interactive dashboards that provide reports with a rich variety of visualization tools. Nice UI – Great dashboards for C-level executives. Good aggregation – Impressive summary data.
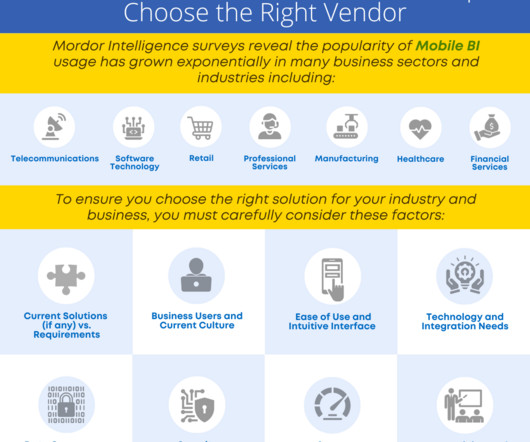
In this article, we will discuss Mobile Business Intelligence, also known as Mobile BI. This article will help businesses to understand the value of a mobile BI approach, and Mobile Business Intelligence best practices. Let’s start by answering the question, ‘ what is mobile BI ?’
In this article, we will explore the importance of Big Data, why enterprises need Big Data tools, how to choose the right Big Data analytics tools and provide a list of the top 10 Big Data analytics tools available today. ” This type of Analytics includes traditional query and reporting settings with scorecards and dashboards.
This article is about facts. These normally appear at the end of an article, but it seemed to make sense to start with them in this case: Recently I published Building Momentum – How to begin becoming a Data-driven Organisation. Facts are sometimes less solid than we would like to think; sometimes they are downright malleable.
We organize all of the trending information in your field so you don't have to. Join 42,000+ users and stay up to date on the latest articles your peers are reading.
You know about us, now we want to get to know you!
Let's personalize your content
Let's get even more personalized
We recognize your account from another site in our network, please click 'Send Email' below to continue with verifying your account and setting a password.
Let's personalize your content