This site uses cookies to improve your experience. To help us insure we adhere to various privacy regulations, please select your country/region of residence. If you do not select a country, we will assume you are from the United States. Select your Cookie Settings or view our Privacy Policy and Terms of Use.
Cookie Settings
Cookies and similar technologies are used on this website for proper function of the website, for tracking performance analytics and for marketing purposes. We and some of our third-party providers may use cookie data for various purposes. Please review the cookie settings below and choose your preference.
Used for the proper function of the website
Used for monitoring website traffic and interactions
Cookie Settings
Cookies and similar technologies are used on this website for proper function of the website, for tracking performance analytics and for marketing purposes. We and some of our third-party providers may use cookie data for various purposes. Please review the cookie settings below and choose your preference.
Strictly Necessary: Used for the proper function of the website
Performance/Analytics: Used for monitoring website traffic and interactions
1) What Are Productivity Metrics? 3) Productivity Metrics Examples. 4) The Value Of Workforce Productivity Metrics. What Are Productivity Metrics? Productivity metrics are measurements used by businesses to evaluate the performance of employees on various activities related to their general company goals.
The way data is collected online and what happens to it is a much-scrutinized issue (and rightly so). Digital datacollection is also exceedingly complex, perhaps a reflection of the organic nature, and subsequent explosion, of the internet. Web DataCollection Context: Cookies and Tools. La vita è bella.
An Operations Key Performance Indicator (KPI) or metric is a discrete measurement that a company uses to monitor and evaluate the efficiency of its day-to-day operations. Why Your Company Should Be Using Operational Metrics to Stay Competitive. This allows management to quickly make informed decisions that are backed up by data.
Understanding and tracking the right software delivery metrics is essential to inform strategic decisions that drive continuous improvement. When tied directly to strategic objectives, software delivery metrics become business enablers, not just technical KPIs. This alignment sets the stage for how we execute our transformation.
In our previous article, What You Need to Know About Product Management for AI , we discussed the need for an AI Product Manager. In this article, we shift our focus to the AI Product Manager’s skill set, as it is applied to day to day work in the design, development, and maintenance of AI products.
While sometimes it’s okay to follow your instincts, the vast majority of your business-based decisions should be backed by metrics, facts, or figures related to your aims, goals, or initiatives that can ensure a stable backbone to your management reports and business operations. 3) Gather data now. 6) Analyze and understand.
In your daily business, many different aspects and ‘activities’ are constantly changing – sales trends and volume, marketing performance metrics, warehouse operational shifts, or inventory management changes. The next in our rundown of dynamic business reports examples comes in the form of our specialized SaaS metrics dashboard.
An engineering Key Performance Indicator (KPI) or metric is a clearly defined quantifiable measure that an engineering firm uses to gauge its success over time. With engineering being a very broad field, KPIs are employed in a variety of ways, ranging from company-wide analysis to project specific performance metrics.
I provide below my perspective on what was interesting, innovative, and influential in my watch list of the Top 10 data innovation trends during 2020. 1) Automated Narrative Text Generation tools became incredibly good in 2020, being able to create scary good “deep fake” articles.
A COO (chief operating officer) dashboard is a visual management tool used by COOs to connect multiple data sources, track, evaluate, and help COOs to optimize operational processes within a company by using interactive metrics and advanced analytical capabilities. Choose the most valuable metrics for your industry.
There are also many important considerations that go beyond optimizing a statistical or quantitative metric. Just the other day, I searched Google for recent news stories about AI, and I was surprised by the number of articles that touch on fairness. How to build analytic products in an age when data privacy has become critical”.
This article goes behind the scenes on whats fueling Blocks investment in developer experience, key initiatives including the role of an engineering intelligence platform , and how the company measures and drives success. Rather, Coburns team optimizes for fast experimentation and a metrics-driven approach.
We have talked extensively about the many industries that have been impacted by big data. many of our articles have centered around the role that data analytics and artificial intelligence has played in the financial sector. However, many other industries have also been affected by advances in big data technology.
Here are four specific metrics from the report, highlighting the potentially huge enterprise system benefits coming from implementing Splunk’s observability and monitoring products and services: Four times as many leaders who implement observability strategies resolve unplanned downtime in just minutes, not hours or days.
The process of Marketing Analytics consists of datacollection, data analysis, and action plan development. Understanding your marketing data to make more informed and successful marketing strategy decisions is a systematic process. Types of Data Used in Marketing Analytics. Preparing the Data for Analysis.
However, embedding ESG into an enterprise data strategy doesnt have to start as a C-suite directive. Developers, data architects and data engineers can initiate change at the grassroots level from integrating sustainability metrics into data models to ensuring ESG data integrity and fostering collaboration with sustainability teams.
Human resources (HR) professionals play a critical role in this process, and one powerful tool they can utilize is HR metrics. By understanding and implementing the right HR metrics, organizations can make data-driven decisions, optimize their workforce, and ultimately drive organizational success.
An insurance Key Performance Indicator (KPI) or metric is a measure that an insurance company uses to monitor its performance and efficiency. Insurance metrics can help a company identify areas of operational success, and areas that require more attention to make them successful. This insurance metric helps gauge two different aspects.
These findings illustrate the benefits of shifting towards a data-driven approach to monitoring employee performance. An article in HR Voices titled Data Analytics in HR: Impacting the Future of Performance Management underscores some of the benefits.
In the ever-evolving and increasingly competitive global e-commerce sector, businesses that strive to achieve and maintain high conversion rates face the pressing, yet necessary, task of harnessing the potential of accessible data. Analyzing these metrics will shed light on any barriers, which helps you reach your sales goals.
Preparing for an artificial intelligence (AI)-fueled future, one where we can enjoy the clear benefits the technology brings while also the mitigating risks, requires more than one article. This first article emphasizes data as the ‘foundation-stone’ of AI-based initiatives. Establishing a Data Foundation.
A CTO dashboard is a critical tool in the process of evaluating, monitoring, and analyzing crucial high-level IT metrics such as support expenses or critical bugs, e.g., with the goal to create a centralized and dynamic point of access for all relevant IT data. Try our professional dashboard software for 14 days, completely free!
Interval: a measurement scale where data is grouped into categories with orderly and equal distances between the categories. For a more in-depth review of scales of measurement, read our article on data analysis questions. Data analysis and interpretation, in the end, help improve processes and identify problems.
Besides, reporting solutions support managers put together a picture of the relevant data and discover business insides. For most companies, the staffs spend 50% time on datacollection, 30% time on checking and approving the data, 15% time on developing and publishing the reports, and 5% on business analysis.
A 2017 study from Harvard Medical School discusses some of the changes big data has created for nurses. In this article, we talk about how big data technology impacts nurses and the communities they serve. There are more ways than ever to provide high-quality healthcare evaluations, and datacollection remotely.
Gather Data on Current Issues : Conduct a thorough assessment of ongoing data quality problems. Use quantitative metrics where possible and gather qualitative feedback from data users. This is where you channel your inner data quality guru and build consensus for sustainable solutions.
A distribution Key Performance Indicator (KPI) or metric is a measure that a company in the distribution sector uses to monitor its performance and efficiency. These metrics help companies identify areas of operational success and failure through measuring specific quantifiable aspects of their business.
Aubree Smith has a great article on Sprout Social highlighting the benefits of leveraging them together. Data Points to Consider Several key data points should be considered to gain a comprehensive understanding of one’s social media presence and its impact. Many companies are following her direction.
The three biggest enemies to user onboarding are the lack of data analysis, datacollection, and the wrong amount of information. Unfortunately, many businesses worldwide are not doing a good job collectingdata and thus, fail to enhance customer relationships. Pay attention to the metrics. Wrapping it up.
Experts say that BI and data analytics makes the decision-making process 5x times faster for businesses. Renowned author Bernard Marr wrote an insightful article about Shell’s journey to become a fully data-driven company. Let’s look at our first use case. 5) Find improvement opportunities through predictions.
One of the primary sources of that knowledge comes from our Knowledge Articles. These Knowledge Articles have proven to be invaluable to our Support Staff over the years. To that end, we have been working on improving the way our customers discover the collection of knowledge available in our Knowledge Articles.
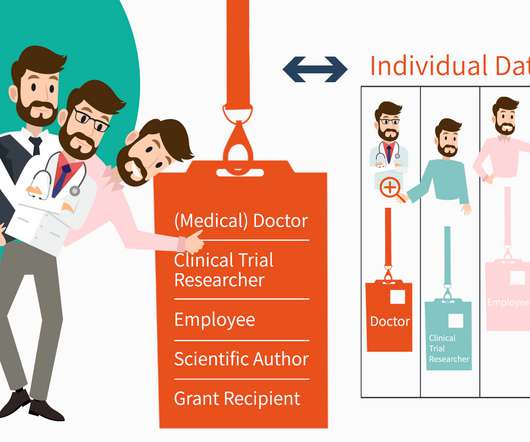
Between them, the faculty members have published more than ten thousand peer-reviewed scientific articles, many in top ranking Pediatrics journals. In fact, the challenge is even more complicated than it appears at a first glance because the methods for datacollection lead to differences in coverage and reliability.
There are three elements to our "big data" efforts, or unhyped normal data efforts: DataCollection, Data Reporting, and Data Analysis. Your data presentation is your brand. This graph is from an article by the consulting company McKinsey. It actually shows very interesting data.
.” The 2020 MSP 501 and NextGen 101 lists are based on datacollected by Channel Futures and its sister site, Channel Partners. Data was collected in 2020. The MSP 501 list recognizes top managed service providers based on metrics including recurring revenue, profit margin and other factors.
This article was co-authored by Katherine Kennedy , an Associate at Metis Strategy. Digitizing operations, experiences, and products will not only save time and money, but also increase speed to insight by breaking down silos and making critical data more accessible. Smarter operations through integrated data and analytics.
In this article, we’ll be discussing 3 reasons why most digital transformation initiatives continue to fail so you can be aware of the red flags, and avoid them altogether. However, after putting in place infrastructure for this database, you realize you need to improve your datacollection methods. Let’s get started.
Streamline budget creation and distribution by integrating planning data with live ERP actuals. These metrics are important to be able to understand the impact of costs and change in order to create sustainable business models and seek new forms of revenue and funding. Admissions and enrollment.
Employ a Chief Data Officer (CDO). Big data guru Bernard Marr wrote about The Rise of Chief Data Officers. Before going all-in with datacollection, cleaning, and analysis, it is important to consider the topics of security, privacy, and most importantly, compliance. Think of security, privacy, and compliance.
In this article we discuss why fitting models on imbalanced datasets is problematic, and how class imbalance is typically addressed. Further, imbalanced data exacerbates problems arising from the curse of dimensionality often found in such biological data. synthetic = np.empty((N * t, numattrs)) synth_idx = 0.
Companies with successful ML projects are often companies that already have an experimental culture in place as well as analytics that enable them to learn from data. Ensure that product managers work on projects that matter to the business and/or are aligned to strategic company metrics. It just looks like plausible English.
This article shows you a comprehensive guide on Financial Reporting and Financial Analysis and illustrates how to use them appropriately. . As the name suggests, financial reporting is a method of compilation and reproduction of crucial financial data in a structured and readable manner. This article provides four ideas for reference.
An interactive dashboard is a data management tool that tracks, analyzes, monitors, and visually displays key business metrics while allowing users to interact with data, enabling them to make well-informed, data-driven, and healthy business decisions. Benefit from amazing interactive dashboards!
We’ll actually do this later in this article. These support a wide array of uses, such as data analysis, manipulation, visualizations, and machine learning (ML) modeling. These libraries are used for datacollection, analysis, data mining, visualizations, and ML modeling. R libraries.
In this article, we explore model governance, a function of ML Operations (MLOps). We can think of model lineage as the specific combination of data and transformations on that data that create a model. This maps to the datacollection, data engineering, model tuning and model training stages of the data science lifecycle.
We organize all of the trending information in your field so you don't have to. Join 42,000+ users and stay up to date on the latest articles your peers are reading.
You know about us, now we want to get to know you!
Let's personalize your content
Let's get even more personalized
We recognize your account from another site in our network, please click 'Send Email' below to continue with verifying your account and setting a password.


Let's personalize your content