This site uses cookies to improve your experience. To help us insure we adhere to various privacy regulations, please select your country/region of residence. If you do not select a country, we will assume you are from the United States. Select your Cookie Settings or view our Privacy Policy and Terms of Use.
Cookie Settings
Cookies and similar technologies are used on this website for proper function of the website, for tracking performance analytics and for marketing purposes. We and some of our third-party providers may use cookie data for various purposes. Please review the cookie settings below and choose your preference.
Used for the proper function of the website
Used for monitoring website traffic and interactions
Cookie Settings
Cookies and similar technologies are used on this website for proper function of the website, for tracking performance analytics and for marketing purposes. We and some of our third-party providers may use cookie data for various purposes. Please review the cookie settings below and choose your preference.
Strictly Necessary: Used for the proper function of the website
Performance/Analytics: Used for monitoring website traffic and interactions
This article was published as a part of the Data Science Blogathon. Introduction One of the most important applications of Statistics is looking into how two or more variables relate. Measuring the strength of that relationship […]. Measuring the strength of that relationship […].
ArticleVideo Book This article was published as a part of the Data Science Blogathon Statistics. The post The Measure of Central Tendencies in Statistics -A Beginner’s Guide appeared first on Analytics Vidhya. Whenever I hear this term, I imagine of below Image.
Probability is a cornerstone of statistics and data science, providing a framework to quantify uncertainty and make predictions. This article unpacks these concepts with clear explanations and examples. Probability measures the likelihood of an event […] The post What are Joint, Marginal, and Conditional Probability?
This article was published as a part of the Data Science Blogathon. Introduction There are so many performance evaluation measures when it comes to. The post Decluttering the performance measures of classification models appeared first on Analytics Vidhya.
ArticleVideo Book This article was published as a part of the Data Science Blogathon. The post 3 Central Tendency Measures – Mean, Mode, Median appeared first on Analytics Vidhya. When we learn Data Science as beginners we came across.
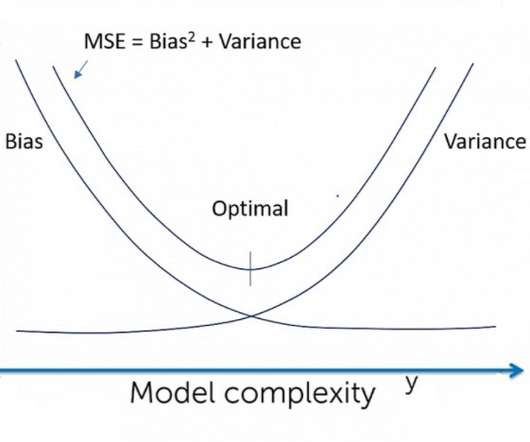
This article was published as a part of the Data Science Blogathon. Introduction One of the most used matrices for measuring model performance is. The post A Measure of Bias and Variance – An Experiment appeared first on Analytics Vidhya.
ArticleVideo Book This article was published as a part of the Data Science Blogathon. The post A/B Testing Measurement Frameworks ?- ?Every What is A/B testing? A/B Testing(split testing) is basically the. Every Data Scientist Should Know appeared first on Analytics Vidhya.
Introduction This article explores ordinal data, a type of data with values that have a meaningful order but unknown magnitude between consecutive values.
For example, articles about former US vice president Al Gore might not discuss actor Tommy Lee Jones, although the two were roommates at Harvard and started a country band together. presented the TRACE framework for measuring results, which showed how GraphRAG achieves an average performance improvement of up to 14.03%.
ArticleVideo Book This article was published as a part of the Data Science Blogathon. Introduction What is the first measure coming into your mind. The post Confusion Matrix: Detailed intuition and trick to learn appeared first on Analytics Vidhya.
By implementing the right reporting tools and understanding how to analyze as well as to measure your data accurately, you will be able to make the kind of data driven decisions that will drive your business forward. Qualitative data analysis is based on observation rather than measurement. Of course, this sounds incredible in theory.
A recent O’Reilly survey found that those with mature AI practices (as measured by how long they’ve had models in production) cited “Lack of data or data quality issues” as the main bottleneck holding back further adoption of AI technologies. See this article on data integration status for details.
There are also many important considerations that go beyond optimizing a statistical or quantitative metric. As we deploy ML in many real-world contexts, optimizing statistical or business metics alone will not suffice. Classification parity means that one or more of the standard performance measures (e.g.,
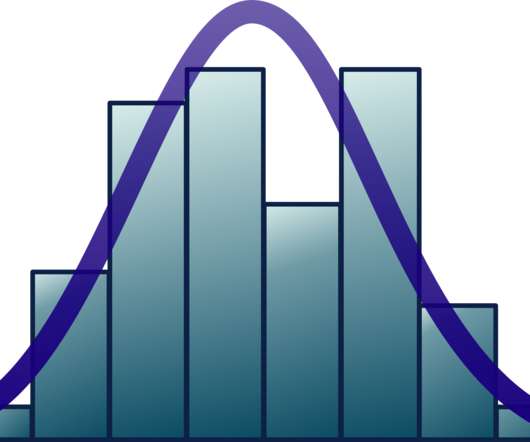
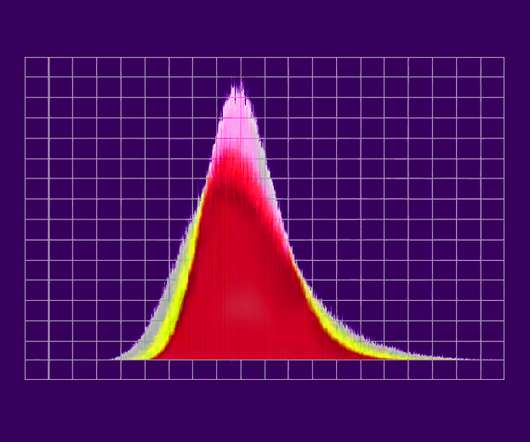
ArticleVideo Book This article was published as a part of the Data Science Blogathon. “Skewness essentially measures the symmetry of the distribution, while kurtosis. The post Shape of data: Skewness and Kurtosis appeared first on Analytics Vidhya.
This: You understand all the environmental variables currently in play, you carefully choose more than one group of "like type" subjects, you expose them to a different mix of media, measure differences in outcomes, prove / disprove your hypothesis (DO FACEBOOK NOW!!!), Measuring Incrementality: Controlled Experiments to the Rescue!
This article quotes an older market projection (from 2019) , which estimated “the global industrial IoT market could reach $14.2 Another dimension to this story, of course, is the Future of Work discussion, including creation of new job titles and roles, and the demise of older job titles and roles. trillion by 2030.”.
We detailed the benefits and costs of good or bad quality data in our previous article on data quality management , where you can read the five important pillars to follow. ARIMA techniques are complex and drawing conclusions from the results may not be as straightforward as for more basic statistical analysis approaches.
Yet, before any serious data interpretation inquiry can begin, it should be understood that visual presentations of data findings are irrelevant unless a sound decision is made regarding scales of measurement. Interval: a measurement scale where data is grouped into categories with orderly and equal distances between the categories.
The article was titled, A Dearth of Data Helped Hong Kong Succeed , and it was written by Jairaj Devadiga. The article explains an odd fact that Hong Kong’s economic policy management during a period of high growth was correlated with a lack of central (e.g. I found the article most stimulating for a number of reasons.
That said, measuring the success of your those efforts is another great part of the job, and on many occasions, it can prove to be overwhelming as you need to use multiple tools to gather the data. While this indicator might be subjective, it is a good reference to evaluate how easy to read your articles are. click to enlarge**.
The business can harness the power of statistics and machine learning to uncover those crucial nuggets of information that drive effective decision, and to improve the overall quality of data. It shows the quality of the dataset and number of columns with listing down the missing values, duplicates, and measure and dimension columns.
5) How Do You Measure Data Quality? In this article, we will detail everything which is at stake when we talk about DQM: why it is essential, how to measure data quality, the pillars of good quality management, and some data quality control techniques. We will go over them in the third part of this article.
Some of that uncertainty is the result of statistical inference, i.e., using a finite sample of observations for estimation. But there are other kinds of uncertainty, at least as important, that are not statistical in nature. Representational uncertainty : the gap between the desired meaning of some measure and its actual meaning.
According to the US Bureau of Labor Statistics, demand for qualified business intelligence analysts and managers is expected to soar to 14% by 2026, with the overall need for data professionals to climb to 28% by the same year. The Bureau of Labor Statistics also states that in 2015, the annual median salary for BI analysts was $81,320.
Data science needs knowledge from a variety of fields including statistics, mathematics, programming, and transforming data. Mathematics, statistics, and programming are pillars of data science. In data science, use linear algebra for understanding the statistical graphs. It is the building block of statistics.
Of course, this statistic predates the pandemic. RetailDive recently published an article titled Furniture retailer embraces digital marketing and measures its impact with analytics , which underscores the benefits that analytics offers. The article cites a furniture store owner that discovered 16.8%
This increase was driven in part by the launch of my new Maths & Science section , articles from which claimed no fewer than 6 slots in the 2018 top 10 articles, when measured by hits [1]. This is my selection of the articles that I enjoyed writing most, which does not always overlap with the most popular ones.
This article is meant to be a short, relatively technical primer on what model debugging is, what you should know about it, and the basics of how to debug models in practice. Residuals are a numeric measurement of model errors, essentially the difference between the model’s prediction and the known true outcome.
Computer Vision: Data Mining: Data Science: Application of scientific method to discovery from data (including Statistics, Machine Learning, data visualization, exploratory data analysis, experimentation, and more). They provide more like an FAQ (Frequently Asked Questions) type of an interaction. Industry 4.0 3) Warehouse / Logistics. (4)
This region provides a robust measure of the spread of the central 50% of the curves. Median Curve: The median curve represents the most central observation and serves as a robust statistic for centrality. This allows for the definition of functional quantiles and the identification of central and outlying observations.
In this article, we are going to look into the two advanced technologies – IoT and AI which have brought some tremendous changes to the sports sector. But the performance data used in recruitment goes beyond statistics like goals, home runs, and passes. Performance and training analysis. AI is Invaluable to the Field of Sports.
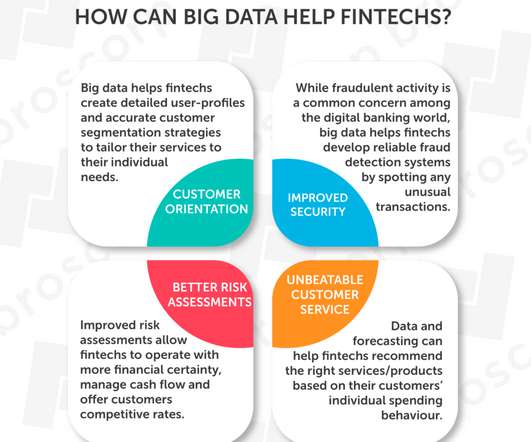
Statistics show that 93% of customers will offer repeat business when they encounter a positive customer experience. This article focuses on big data in financial industry, its role, and how it helps fintech companies protect their customers and improve the customer experience. The Role Of Big Data In Fintech.
Data analytics refers to the systematic computational analysis of statistics or data. In this article, you’ll learn the different ways data analytics sets a new standard for revenue marketing. With it, you can measure your key performance indicators quickly and more objectively than traditional methods.
Learning from visitor behaviors and using statistics requires a balance between understanding data and understanding marketing. In that sense, a bounce is measured as a failure. However, if someone visits your site and reads a full article or signs up for your newsletter, that’s not really a failure at all.
UMass Global has a very insightful article on the growing relevance of big data in business. It refers to datasets too large for normal statistical methods. In this article, we’ll explore the importance of data gathering for businesses and how residential proxies can help improve the process.
This article will focus on the different stages of this process: Types of Data, Data Collection, and Data Analysis. The first step is setting the goals and defining what success metrics you want to measure. But, the first step in any good process is to identify the goals and define what success metrics you want to measure.
This article delves into the profound impact data analytics can have on fast food legal cases. It is an interdisciplinary field, combining computer science, statistics , mathematics, and business intelligence. Data Analysis The cleaned data is then analyzed using various statistical techniques and algorithms.
Moreover, measuring these metrics will also avert potential customer frustrations, monitor customer satisfaction levels, and give you a more concrete, informed idea of how your customer-facing team is doing. How To Measure Customer Satisfaction? How To Measure Customer Satisfaction? Without further ado, let’s get going.
How can you use it to analyze your current situation, and measure the results of any actions you take? Without them, this article wouldn’t have been possible. If you take some action, what changes? Most actions have multiple effects. Decide where data fits in. What data do you have? All three have upcoming books from O’Reilly.
In this article, we will go deeper into the definition of product KPIs: what they are, who needs them, and why; then, we will go over the steps to find the best product success metrics; and finally, we will provide some useful examples. They can evaluate architectural measures, quality measures, software complexity, or functional size.
This involves identifying, quantifying and being able to measure ethical considerations while balancing these with performance objectives. As discussed in this article , model design can also be a source of bias too. Uncertainty is a measure of our confidence in the predictions made by a system. System Design. Model Drift.
This article will explore data mining and how it can help online brands with brand optimization. It involves using statistical algorithms and machine learning techniques to identify trends and patterns in the data that would otherwise be difficult to detect. What is Data Mining?
Fortunately, we live in a digital age rife with statistics, data, and insights that give us the power to spot potential issues and inefficiencies within the business. With so many areas to consider, deciding which KPIs to focus on while defining metric measurement periods can prove to be a challenge at the initial stages.
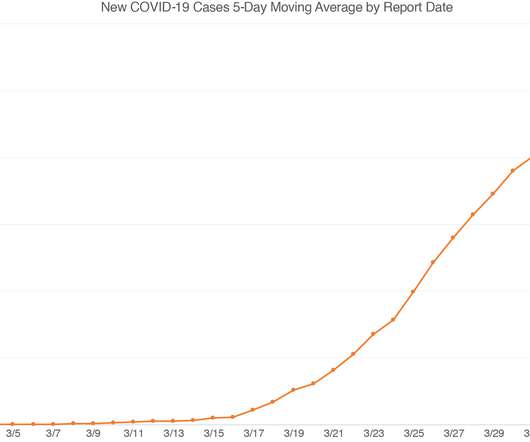
Statistics are playing a major role during the COVID-19 pandemic. The purpose of the Investor’s Business Daily article was to examine how the pandemic was affecting the stock market. Because the article did not identify its data source, I chose to base the graph below on official CDC data, so the numbers are a little different.
We organize all of the trending information in your field so you don't have to. Join 42,000+ users and stay up to date on the latest articles your peers are reading.
You know about us, now we want to get to know you!
Let's personalize your content
Let's get even more personalized
We recognize your account from another site in our network, please click 'Send Email' below to continue with verifying your account and setting a password.


Let's personalize your content