This site uses cookies to improve your experience. To help us insure we adhere to various privacy regulations, please select your country/region of residence. If you do not select a country, we will assume you are from the United States. Select your Cookie Settings or view our Privacy Policy and Terms of Use.
Cookie Settings
Cookies and similar technologies are used on this website for proper function of the website, for tracking performance analytics and for marketing purposes. We and some of our third-party providers may use cookie data for various purposes. Please review the cookie settings below and choose your preference.
Used for the proper function of the website
Used for monitoring website traffic and interactions
Cookie Settings
Cookies and similar technologies are used on this website for proper function of the website, for tracking performance analytics and for marketing purposes. We and some of our third-party providers may use cookie data for various purposes. Please review the cookie settings below and choose your preference.
Strictly Necessary: Used for the proper function of the website
Performance/Analytics: Used for monitoring website traffic and interactions
That’s why it’s critical to monitor and optimize relevant supply chain metrics. Finally, we will show how to combine those metrics with the help of modern KPI software and create professional supply chain dashboards. Your Chance: Want to visualize & track supply chain metrics with ease? Cash-to-cash Time Cycle.
Here, we’ll examine 18 essential KPIs for social media, explore the dynamics and demonstrate the importance of social metrics in the modern business age with the help of a KPI software , and, finally, wrapping up with tips on how to set KPIs and make the most of your social platforms. Let’s get going. What Are Social Media KPIs?
1) What Are Productivity Metrics? 3) Productivity Metrics Examples. 4) The Value Of Workforce Productivity Metrics. What Are Productivity Metrics? Productivity metrics are measurements used by businesses to evaluate the performance of employees on various activities related to their general company goals.
6) Data Quality Metrics Examples. In this article, we will detail everything which is at stake when we talk about DQM: why it is essential, how to measure data quality, the pillars of good quality management, and some data quality control techniques. Industry-wide, the positive ROI on quality data is well understood.
They are finding new ways to leverage data analytics and AI technology to maximize their ROI. Keep reading to learn more about the metrics that data-driven online stores are prioritizing. Metrics Analytics-Driven E-Commerce Companies Focus On. This is one of the easiest metrics to evaluate with the right analytics tools.
But alongside its promise of significant rewards also comes significant costs and often unclear ROI. In this article, we will explore the cost-related barriers to GenAI adoption, including high implementation expenses, ineffective cost management, and infrastructure demands. million in 2025 to $7.45
Analytics are the products, the outcomes, and the ROI of our Big Data , Data Science, AI, and Machine Learning investments! So we should keep our eye on the prize — maintaining our focus on the business outcomes (the analytics), which are data-fueled, technology-enabled, and metrics-verified. That’s the essence of Analytics by Design.
In this day and age, all businesses must pay especially close consideration to the performance of their marketing metrics dashboard. Key performance indicators are the most crucial metrics that serve as a compass for navigating the path forward on every marketing road map. Most of the time, they are external and internal.
In this article, we will cover every fundamental aspect to take advantage of agency analytics. As with any other business out there, agencies manage big amounts of data in the form of surveys, social media metrics, website performance, or any other information related to their client’s goals. click to enlarge**.
In this article, were going to share an emerging SDLC for LLM applications that can help you escape POC Purgatory. Business value : Once we have a rubric for evaluating our systems, how do we tie our macro-level business value metrics to our micro-level LLM evaluations? How do we do so? We tested both retrieval quality (e.g.,
Below, in the article, we’ve gathered some of the marketing reports templates that can easily be used to perfect the efficiency of generating data and reduce the time needed to create it. Structure your metrics. That way you can choose the best possible metrics for your case. Use professional software. 1) Marketing CMO report.
Modern content performance reports in the shape of an interactive online dashboard present an intuitive and accessible way to assess your content’s success and its ROI in real-time and in one centralized location. Enter modern content reports. Which we present below. What Is A Content Dashboard?
By the end of this article, making stunning and useful managerial reports will be second nature to you. As a Growthforce article states, management reporting helps answer some of the following questions for a CEO: “Am I pricing my jobs right? But before we get into the nitty-gritty, let’s give you a bit of background.
Managers tend to incentivize activity metrics and measure inputs versus outputs,” she adds. Or instead of writing one article for the company knowledge base on a topic that matters most to them, they might submit a dozen articles, on less worthwhile topics. The solution is to rethink how companies give employees incentives.
Each one paired with the business metrics its meant to move. For each product line, include the total cost of ownership and the business metrics the team is driving. It means embedding this allocation logic into your general ledger to automate reporting and show real-time ROI. Side-by-side with metrics. Always up to date.
In this article, we will explain the basic definition of procurement reports, talk about the benefits and challenges that occur when dealing with procurement data to provide you with innovative ideas on spotting inefficiencies. We will see this in our procurement report sample below in the article. e) Take accurate measurements.
Investments in AI agent projects are expected to yield orders of magnitude in ROI and business value if companies select high-impact use cases. There is no faster way to erode ROI than through unneeded token costs and extra processing costs. Now is the time to explore agentic AI. But then, that’s where we must dive in slowly.
Developers, data architects and data engineers can initiate change at the grassroots level from integrating sustainability metrics into data models to ensuring ESG data integrity and fostering collaboration with sustainability teams. However, embedding ESG into an enterprise data strategy doesnt have to start as a C-suite directive.
Here are four specific metrics from the report, highlighting the potentially huge enterprise system benefits coming from implementing Splunk’s observability and monitoring products and services: Four times as many leaders who implement observability strategies resolve unplanned downtime in just minutes, not hours or days.
Struggling to improve your ROI? Learn about the key metrics to consider when monitoring the progress of your SEO operations here. We talked about this in our article on the benefits of data-driven SEO. Analytics is the driver of maximizing the success of SEO initiatives. In a market that's projected to expand
For example, in regards to marketing, traditional advertising methods of spending large amounts of money on TV, radio, and print ads without measuring ROI aren’t working like they used to. Renowned author Bernard Marr wrote an insightful article about Shell’s journey to become a fully data-driven company.
Unlike marketing metrics, knowledge management is challenging to measure. For example, how many articles should a company write to provide a comprehensive and exhaustive knowledge base? ‘. Top 6 Knowledge Management Metrics to Measure Employee Engagement. So, regularly monitor these metrics. Knowledge base adoption.
This insightful report displays relevant metrics such as the top-performing agents, net promoter score, and first contact resolution rate, among others. It serves up a balanced blend of metrics that will empower you to boost engagement as well as retention rates.
The use of new and cutting edge technologies and the seamless incorporation of these technologies is critical to the success of the analytical application implementation and to return on investment (ROI) and total cost of ownership (TCO) metrics. Read our free article, The Benefits Of Low-Code No-Code in Augmented Analytics.
This article will focus on the different stages of this process: Types of Data, Data Collection, and Data Analysis. These insights optimized his marketing efforts for better ROI and conversion rates. The first step is setting the goals and defining what success metrics you want to measure. Data is a constant in today’s world.
Data analytics make up the relevant key performance indicators ( KPIs ) or metrics necessary for a business to create various sales and marketing strategies. In this article, you’ll learn the different ways data analytics sets a new standard for revenue marketing.
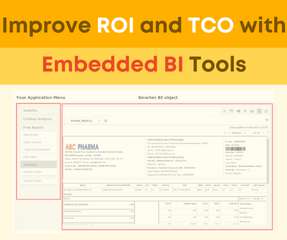
Embedded BI Improves ROI and TCO for Existing Technology and Benefits Business Users! One of the often-overlooked advantages of this strategy is the improvement of return on investment (ROI) and total cost of ownership (TCO).
Without it, businesses incur steep costs, but the downside, or costs, are often unclear because calculating data management’s return on investment (ROI), or upside, is a murky exercise. For many organizations, the real challenge is quantifying the ROI benefits of data management in terms of dollars and cents.
Instagram has a sophisticated data analytics platform that makes it easier for advertisers to optimize their strategies for the highest possible ROI. In this article, we’ll show you how to make Instagram highlight covers that will make your Highlights look even more amazing. Better Structuring with Highlight Covers for Instagram.
Link building is one of the best online marketing strategies in use today, thanks to its synergy with other marketing strategies and its incredibly high return on investment (ROI). Secondary performance metrics. Overall ROI. This way, the content is valuable for both readers and publishers, and the link works well in context.
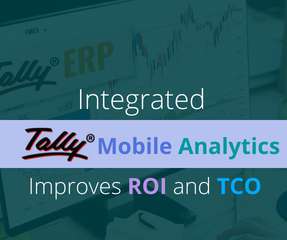
Increase the ROI and TCO of Tally ERP with Integrated Tally Mobile Analytics! If you are considering, or have already purchased software, you probably faced the questions from your management team about return on investment (ROI) and total cost of ownership (TCO). On the surface, the calculations for TCO and ROI may seem simple.
The metrics that you should be using. The relevance of various metrics and tools and the way they fit carefully into your long-term strategy. This article is a good read for anyone that is still skeptical of the benefits of analytics in digital marketing. You can also discover keywords that yielded a poor ROI and replace them.
In this article, we are going to take a closer look at one of the world’s largest platforms for marketing automation – Salesforce. Salesforce marketing tools also have a feature for reporting on fundamental metrics. Keep track of the key metrics in all stages of the system’s implementation. Analyze and adjust as you go.
And they want to know exactly how much return on investment (ROI) can be expected when IT leaders make technology-related changes. CFOs have grown comfortable with the traditional project-based approach, through which they believe they get a better handle on spend certainty and a better sense of ROI.
This article will delve into this in more detail. This article will discuss everything you need to know about Instagram stories for business and how to use analytics to maximize your ROI: What are Instagram Stories for business? However, you will only get more value by leveraging analytics if you know what metrics to focus on.
With a new year on the horizon, in this article, we’ll explore 10 essential SaaS trends that will stand out in 2020. Pre-defined metrics and KPIs: Vertical SaaS is already integrated with pre-defined metrics, KPIs , and analytics that businesses can utilize to assess and address daily and long-term processes and performance.
A recent article in The Washington Post aptly titled, “The AI hype bubble is deflating. The reality is that the Return on AI still depends on traditional metrics: cost savings and revenue generation. Artificial Intelligence, ROI and Metrics How do we get there?
Moreover, a business intelligence strategy with visualization capabilities boasts a ROI of $13.01 While pie charts have received a bad rep in recent years, we feel that they form a useful visualization tool that serves up important metrics in an easy-to-follow format. back on every dollar spent. c) Pie charts. d) Gauge charts.
Often though, atleast online, our hopes are dashed, efforts expended rarely have adequate ROI, the hype is followed with a bucket of cold water. So much so that recently I was compelled to pen a warning post: “Engagement” Is Not A Metric, It’s An Excuse. It is more that our execution efforts in measuring engagement are fatally flawed.
A chief technology officer (also referred to as chief technical officer or chief technologist), has an immense responsibility to drive a company forward and lead the technological advancements, research, development, and management in order to generate business value and increase the return on investment (ROI). What Is A CTO Dashboard?
Before any serious data analysis can begin, the scale of measurement must be decided for the data as this will have a long-term impact on data interpretation ROI. For a more in-depth review of scales of measurement, read our article on data analysis questions. Variables are exclusive and exhaustive.
By its very nature, the financial industry (or the financial departments) is rife with facts, figures, financial KPIs , metrics, and data. To create such visuals, you can explore our article on the most prominent recruitment metrics.
A few saved orders are often all it takes to get into positive ROI territory based on increased labor costs. Use the platform you live on to your advantage based on your company’s most important supply chain metrics & KPIs. Increasing the number of scans can likely reduce your error rate by single-digit to double-digit percentages.
One study found that the ROI of UX strategies is 9,900%. You can run split tests with different amounts of negative space to see how it affects conversions and user engagement metrics. For example, if you have a blog with hundreds of articles, you can use a search bar to help users find the specific article they’re looking for.
We organize all of the trending information in your field so you don't have to. Join 42,000+ users and stay up to date on the latest articles your peers are reading.
You know about us, now we want to get to know you!
Let's personalize your content
Let's get even more personalized
We recognize your account from another site in our network, please click 'Send Email' below to continue with verifying your account and setting a password.


Let's personalize your content