This site uses cookies to improve your experience. To help us insure we adhere to various privacy regulations, please select your country/region of residence. If you do not select a country, we will assume you are from the United States. Select your Cookie Settings or view our Privacy Policy and Terms of Use.
Cookie Settings
Cookies and similar technologies are used on this website for proper function of the website, for tracking performance analytics and for marketing purposes. We and some of our third-party providers may use cookie data for various purposes. Please review the cookie settings below and choose your preference.
Used for the proper function of the website
Used for monitoring website traffic and interactions
Cookie Settings
Cookies and similar technologies are used on this website for proper function of the website, for tracking performance analytics and for marketing purposes. We and some of our third-party providers may use cookie data for various purposes. Please review the cookie settings below and choose your preference.
Strictly Necessary: Used for the proper function of the website
Performance/Analytics: Used for monitoring website traffic and interactions
This article was published as a part of the Data Science Blogathon. A Tour of Evaluation Metrics for Machine Learning After we train our. The post A Tour of Evaluation Metrics for Machine Learning appeared first on Analytics Vidhya.
This article was published as a part of the Data Science Blogathon Introduction Before explaining the correlation and correlation metrics, I would like you to answer a simple question. The post Different Type of Correlation Metrics Used by Data Scientists appeared first on Analytics Vidhya.
This powerful metric, called relative entropy or information gain, has become indispensable in various fields, from statistical inference to deep learning.
This article was published as a part of the Data Science Blogathon. The post HOW TO CHOOSE EVALUATION METRICS FOR CLASSIFICATION MODEL appeared first on Analytics Vidhya. INTRODUCTION Yay!! So you have successfully built your classification model. What should.
This article was published as a part of the Data Science Blogathon. The post Quick Guide to Evaluation Metrics for Supervised and Unsupervised Machine Learning appeared first on Analytics Vidhya. Introduction Machine learning is about building a predictive model using historical data.
ArticleVideo Book This article was published as a part of the Data Science Blogathon Evaluation Metrics for Classification Problem Image source ?[link] The post Metrics to Evaluate your Classification Model to take the right decisions appeared first on Analytics Vidhya. link] Abstract The most.
For example, articles about former US vice president Al Gore might not discuss actor Tommy Lee Jones, although the two were roommates at Harvard and started a country band together. While RAG leverages nearest neighbor metrics based on the relative similarity of texts, graphs allow for better recall of less intuitive connections.
6) Data Quality Metrics Examples. In this article, we will detail everything which is at stake when we talk about DQM: why it is essential, how to measure data quality, the pillars of good quality management, and some data quality control techniques. We will go over them in the third part of this article. Table of Contents.
Learning from visitor behaviors and using statistics requires a balance between understanding data and understanding marketing. This metric identifies when someone only views one page of your website before navigating away. The next important metric to pay attention to are your traffic sources. Exit Pages. Traffic Sources.
1) What Are Product Metrics? 2) Types Of Product Metrics. 3) Product Metrics Examples You Can Use. 4) Product Metrics Framework. The right product performance metrics will give you invaluable insights into its health, strength and weaknesses, potential issues or bottlenecks, and let you improve it greatly.
There are also many important considerations that go beyond optimizing a statistical or quantitative metric. As we deploy ML in many real-world contexts, optimizing statistical or business metics alone will not suffice. Models will need to be customized (for specific locations, cultural settings, domains, and applications).
Read here how these metrics can drive your customers’ satisfaction up! Customer satisfaction metrics evaluate how the products or services supplied by a company meet or surpass a customer’s expectations. Exclusive Bonus Content: Get our short guide to CES and NPS! Without further ado, let’s get going. But why?
A data scientist must be skilled in many arts: math and statistics, computer science, and domain knowledge. Statistics and programming go hand in hand. Mastering statistical techniques and knowing how to implement them via a programming language are essential building blocks for advanced analytics. Linear regression.
While sometimes it’s okay to follow your instincts, the vast majority of your business-based decisions should be backed by metrics, facts, or figures related to your aims, goals, or initiatives that can ensure a stable backbone to your management reports and business operations. Quantitative data analysis focuses on numbers and statistics.
While some experts try to underline that BA focuses, also, on predictive modeling and advanced statistics to evaluate what will happen in the future, BI is more focused on the present moment of data, making the decision based on current insights. But let’s see in more detail what experts say and how can we connect and differentiate the both.
A content dashboard is an analytical tool that contains critical performance metrics to assess the success of all content-related initiatives. This most insightful of Google Analytics dashboards provide the perfect mix between overview metrics and more detailed insights. Let’s look at some of these metrics in more detail below.
This article was published as a part of the Data Science Blogathon. Introduction There are so many performance evaluation measures when it comes to. The post Decluttering the performance measures of classification models appeared first on Analytics Vidhya.
We detailed the benefits and costs of good or bad quality data in our previous article on data quality management , where you can read the five important pillars to follow. ARIMA techniques are complex and drawing conclusions from the results may not be as straightforward as for more basic statistical analysis approaches.
The article was titled, A Dearth of Data Helped Hong Kong Succeed , and it was written by Jairaj Devadiga. The article explains an odd fact that Hong Kong’s economic policy management during a period of high growth was correlated with a lack of central (e.g. I found the article most stimulating for a number of reasons.
According to the US Bureau of Labor Statistics, demand for qualified business intelligence analysts and managers is expected to soar to 14% by 2026, with the overall need for data professionals to climb to 28% by the same year. The Bureau of Labor Statistics also states that in 2015, the annual median salary for BI analysts was $81,320.
This article is meant to be a short, relatively technical primer on what model debugging is, what you should know about it, and the basics of how to debug models in practice. For model training and selection, we recommend considering fairness metrics when selecting hyperparameters and decision cutoff thresholds.
Stories inspire, engage, and have the unique ability to transform statistical information into a compelling narrative that can significantly enhance business success. According to a study performed by Skyword, content that features a mix of words and visuals drives 34% more engagement than text-only articles, blog posts, or whitepapers.
many of our articles have centered around the role that data analytics and artificial intelligence has played in the financial sector. In this article, we will explore the crucial role that data collection plays in analyzing football performance, unlocking valuable insights that can shape the future of the sport.
If you are still wondering whether low-code and no-code approaches are appropriate for software and applications, consider these predictions and statistics from technology research organizations: Gartner predicts that 75% of new software solutions will incorporate a low-code approach to development.
This article was published as a part of the Data Science Blogathon. Overview Challenges if we use the Linear Regression model to solve a. The post Binary Cross Entropy aka Log Loss-The cost function used in Logistic Regression appeared first on Analytics Vidhya.
This article will focus on the different stages of this process: Types of Data, Data Collection, and Data Analysis. The data collection process is an ongoing process that starts with setting goals, defining success metrics , identifying what data needs to be collected, and how it will be gathered. Data is a constant in today’s world.
In this article, we are going to look into the two advanced technologies – IoT and AI which have brought some tremendous changes to the sports sector. But the performance data used in recruitment goes beyond statistics like goals, home runs, and passes. Performance and training analysis. AI is Invaluable to the Field of Sports.
Data analytics refers to the systematic computational analysis of statistics or data. Data analytics make up the relevant key performance indicators ( KPIs ) or metrics necessary for a business to create various sales and marketing strategies. Consequently, you can make smarter decisions and hit your metrics and overall business goals.
Some of that uncertainty is the result of statistical inference, i.e., using a finite sample of observations for estimation. But there are other kinds of uncertainty, at least as important, that are not statistical in nature. Among these, only statistical uncertainty has formal recognition. leaves out.
Fortunately, we live in a digital age rife with statistics, data, and insights that give us the power to spot potential issues and inefficiencies within the business. With so many areas to consider, deciding which KPIs to focus on while defining metric measurement periods can prove to be a challenge at the initial stages.
Metrics dashboards enable you and your team to track the effectiveness of various tactics, campaigns, and processes. These KPI metrics are critical data to analyze and evaluate a company’s sales, human resources, and marketing, and operational activities. Dashboard metrics from FineReport. What is dashboard metrics.
For a more in-depth review of scales of measurement, read our article on data analysis questions. More often than not, it involves the use of statistical modeling such as standard deviation, mean and median. Let’s quickly review the most common statistical terms: Mean: a mean represents a numerical average for a set of responses.
Here are some statistics on the importance of AI in marketing : 48% of marketers feel AI makes a greater difference than anything else in affecting their relationship with customers 51% of e-commerce companies use AI to improve the customer experience 64% of B2B marketers use AI to guide their strategy.
A CTO dashboard is a critical tool in the process of evaluating, monitoring, and analyzing crucial high-level IT metrics such as support expenses or critical bugs, e.g., with the goal to create a centralized and dynamic point of access for all relevant IT data. Try our professional dashboard software for 14 days, completely free!
We mentioned predictive analytics in our business intelligence trends article and we will stress it here as well since we find it extremely important for 2020. Without a doubt, it’s a big technological advancement, and one of the big statistics buzzwords, but the extent to which it is believed to be already applied is vastly exaggerated.
an analytic or metric), or some other more sophisticated representative of a model or algorithm. There was an interesting article in today’s US print edition of the Financial Times. In tests every day, if something is found to be statistically significant then it must surely be. The problem is this is not necessarily so.
Messages must be clear and focused and eliminate the unnatural, mechanical chart headings and the unnecessarily complex statistical jargon. How exactly is this metric calculated? But don’t be that presenter who stares incessantly at your metrics and goals. Two paragraphs and 15 slides in, everyone wonders, “Where is this going?
This article will go over the concept of customer service analytics and some of the uses and advantages it could provide to a business. Customer service analytics is a process that involves gathering and evaluating all data and metrics produced by a company’s or organization’s customer care department. Conclusion.
According to statistics, an astonishing 62% of managers are reluctant to talk to their employees about anything, while one in five business leaders feel uncomfortable when it comes to recognizing employees’ achievements. This communication breakdown may be the reason why traditional feedback isn’t working.
As discussed in this article , model design can also be a source of bias too. There are a number of metrics that can be used to measure the performance of a system; they include accuracy, precision and F-score to name only three. We have already covered a few of those applications in this article so far. Model Drift. Regulation.
As a result, your relationship to many important financial metrics changes. The second needs to feed back into the metrics and dashboards for monitoring the system’s behavior. Without them, this article wouldn’t have been possible. You always know your cash flow; you always know your credit line. Is retraining needed?
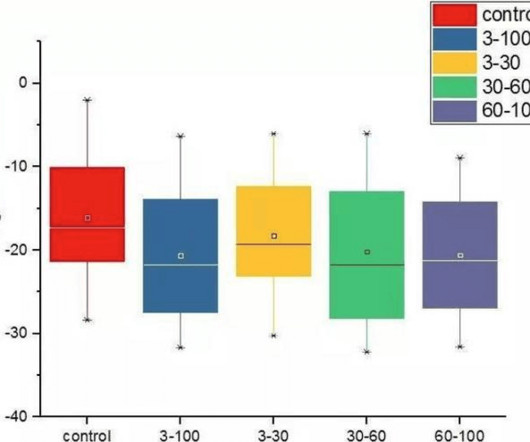
This article aims to provide a detailed interpretation of the various elements of the boxplot, along with analysis and creation techniques, to aid in your journey as a data analyst. Boxplots are non-parametric; they depict variations in the statistical sample without making assumptions about the underlying statistical distribution.
This article covers clustering including K-means and hierarchical clustering. It divides the observations into discrete groups based on some distance metric. According to this metric we should use 13 clusters. shows the Gap statistic for a number of different clusters. A complementary Domino project is available.
If you’re in marketing, you’ve probably heard the mind-blowing statistic that humans process visual information up to 60 000 times faster than text-based info. While there’s definitely still a place for text and written articles, stories that make use of data visualization techniques can be just as effective, if not more.
We organize all of the trending information in your field so you don't have to. Join 42,000+ users and stay up to date on the latest articles your peers are reading.
You know about us, now we want to get to know you!
Let's personalize your content
Let's get even more personalized
We recognize your account from another site in our network, please click 'Send Email' below to continue with verifying your account and setting a password.


Let's personalize your content