This site uses cookies to improve your experience. To help us insure we adhere to various privacy regulations, please select your country/region of residence. If you do not select a country, we will assume you are from the United States. Select your Cookie Settings or view our Privacy Policy and Terms of Use.
Cookie Settings
Cookies and similar technologies are used on this website for proper function of the website, for tracking performance analytics and for marketing purposes. We and some of our third-party providers may use cookie data for various purposes. Please review the cookie settings below and choose your preference.
Used for the proper function of the website
Used for monitoring website traffic and interactions
Cookie Settings
Cookies and similar technologies are used on this website for proper function of the website, for tracking performance analytics and for marketing purposes. We and some of our third-party providers may use cookie data for various purposes. Please review the cookie settings below and choose your preference.
Strictly Necessary: Used for the proper function of the website
Performance/Analytics: Used for monitoring website traffic and interactions
ArticleVideo Book This article was published as a part of the Data Science Blogathon Introduction Plotting is essentially one of the most important steps in. The post Plotting Visualizations Out of Pandas DataFrames appeared first on Analytics Vidhya.
ArticleVideo Book This article was published as a part of the Data Science Blogathon DataVisualizationDataVisualization techniques involve the generation of graphical or. The post Effective DataVisualization Techniques in Data Science Using Python appeared first on Analytics Vidhya.
ArticleVideo Book This article was published as a part of the Data Science Blogathon Introduction In applied Statistics and Machine Learning, DataVisualization is one. The post Must Known DataVisualization Techniques for Data Science appeared first on Analytics Vidhya.
ArticleVideo Book This article was published as a part of the Data Science Blogathon Introduction Matplotlib is a widely used library for datavisualizations. The post Exploring Matplotlib Stylesheets For DataVisualization appeared first on Analytics Vidhya. Matplotlib.
ArticleVideo Book This article was published as a part of the Data Science Blogathon Introduction Datavisualization is the most important step in the life. The post How To Perform DataVisualization with Pandas appeared first on Analytics Vidhya.
ArticleVideo Book This article was published as a part of the Data Science Blogathon DATAVISUALIZATION: DataVisualization is one of the parts of descriptive. The post DATAVISUALIZATION : What Is This And Why It Matters appeared first on Analytics Vidhya.
ArticleVideo Book This article was published as a part of the Data Science Blogathon Introduction DataVisualization helps to bridge the gap between numbers and. The post Plotly and cufflinks : Advanced Python DataVisualization Libraries appeared first on Analytics Vidhya.
ArticleVideo Book This article was published as a part of the Data Science Blogathon Photo by fauxels from Pexels What is Exploratory Data Analysis? The post Exploratory Data Analysis and Visualization Techniques in Data Science appeared first on Analytics Vidhya. Exploratory.
ArticleVideos This article was published as a part of the Data Science Blogathon. Introduction Transforming a data set with Principal Component Analysis (PCA) is. The post Visualizing PCA in R-Programming with Factoshiny appeared first on Analytics Vidhya.
ArticleVideos This article was published as a part of the Data Science Blogathon. Introduction Datavisualization in python is perhaps one of the most. The post An Intuitive Guide to DataVisualization in Python appeared first on Analytics Vidhya.
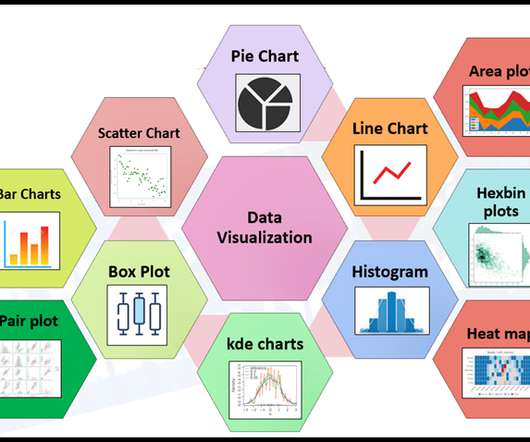
ArticleVideo Book This article was published as a part of the Data Science Blogathon Introduction Human beings are amongst the most creative species on this. The post 8 Charts You Must Know To Excel In The Art of DataVisualization! appeared first on Analytics Vidhya.
ArticleVideo Book This article was published as a part of the Data Science Blogathon. Introduction “A visual always brings a first impression.” The post Pandas Visual Analysis – Interactive Visual Analysis appeared first on Analytics Vidhya. ” It’s a.
ArticleVideo Book This article was published as a part of the Data Science Blogathon Introduction Data is everywhere in today’s world of data, and we. The post Interactive DataVisualization Plots with Plotly and Cufflinks appeared first on Analytics Vidhya.
This article was published as a part of the Data Science Blogathon. ows) Visual Programming Software appeared first on Analytics Vidhya. Introduction If you want to know – How to use MACHINE LEARNING. The post Predicting Employee Attrition using Orange(.ows)
ArticleVideos This article was published as a part of the Data Science Blogathon. Introduction Time series is a series of data that are gathered. The post Visualization in Time Series using Heatmaps in Python appeared first on Analytics Vidhya.
ArticleVideo Book This article was published as a part of the Data Science Blogathon Introduction The twenty-first century can be regarded as the era of. The post Donut Plots : DataVisualization With Python appeared first on Analytics Vidhya.
ArticleVideo Book This article was published as a part of the Data Science Blogathon Overview Nowadays, there are multiple data science projects requiring the use. The post Geospatial visualization via Folium Library appeared first on Analytics Vidhya.
ArticleVideo Book This article was published as a part of the Data Science Blogathon Introduction The DIstribution of data plays an important role in model. The post Ridgeline Plots: VisualizeData with a Joy! appeared first on Analytics Vidhya.
This article was published as a part of the Data Science Blogathon. INTRODUCTION The purpose of datavisualization is insight, not pictures ?Ben The post Exploring the Tale of Music Through DataVisualization appeared first on Analytics Vidhya. Ben Shneiderman.
ArticleVideo Book This article was published as a part of the Data Science Blogathon. Introduction The graphical or pictorial representation of data and information. The post Visualizing Covid Data with Plotly appeared first on Analytics Vidhya.
ArticleVideo Book This article was published as a part of the Data Science Blogathon. This article helps in understanding the importance of data. The post Guide to DataVisualization and Insights appeared first on Analytics Vidhya.
ArticleVideo Book This article was published as a part of the Data Science Blogathon. The post LUX – Intelligence Visual Discovery of data using python appeared first on Analytics Vidhya. Overview Introduction Introduction on the library lux Installation of lux.
ArticleVideo Book This article was published as a part of the Data Science Blogathon . The post Covid-19 Vaccination: Data Analysis & Visualization appeared first on Analytics Vidhya.
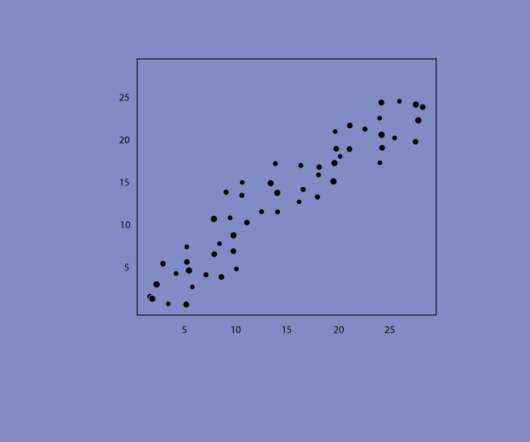
This article was published as a part of the Data Science Blogathon. Introduction Have you ever been tasked with visualizing the relationship between each. The post Creating Linear Model, It’s Equation and Visualization for Analysis appeared first on Analytics Vidhya.
ArticleVideo Book This article was published as a part of the Data Science Blogathon Introduction Have you ever got confused by reading those large data. The post DataVisualization Techniques You MUST Know as a Data Scientist appeared first on Analytics Vidhya.
ArticleVideo Book This article was published as a part of the Data Science Blogathon Data is everywhere you just need an eye to select which. The post Tricks for Datavisualization using Plotly Library appeared first on Analytics Vidhya.
ArticleVideo Book This article was published as a part of the Data Science Blogathon Introduction Hello, Welcome to the world of EDA using DataVisualization. The post Exploratory Data Analysis using DataVisualization Techniques! appeared first on Analytics Vidhya.
This article was published as a part of the Data Science Blogathon Image 1In this blog, We are going to talk about some of the advanced and most used charts in Plotly while doing analysis. All you need to know is Plotly for visualization!
This article was published as a part of the Data Science Blogathon Introduction Dash is an open-source web framework for creating analytical dashboards and datavisualizations. It helps data analysts to deploy dashboards and serve these dashboards to the main web application.
ArticleVideo Book Note: If you are more interested in learning concepts in an Audio-Visual format, we have this entire article explained in the video. The post Create Dual Axis Charts in Tableau appeared first on Analytics Vidhya.
This article was published as a part of the Data Science Blogathon. Introduction In DataVisualization, Dashboard is the great Graphical User Interfaces that. The post Create Interactive Dashboards with Streamlit and Python appeared first on Analytics Vidhya.
This article reflects some of what Ive learned. They promise to revolutionize how we interact with data, generating human-quality text, understanding natural language and transforming data in ways we never thought possible. They can also automate report generation and interpret data nuances that traditional methods might miss.
ArticleVideo Book This article was published as a part of the Data Science Blogathon. Human beings are visual creatures, It means that the human. The post SweetViz Library – EDA in Seconds appeared first on Analytics Vidhya.
ArticleVideo Book This article was published as a part of the Data Science Blogathon DataVisualization is a revolutionary invention that is widely used today. The post Build Treemaps in Python using Squarify appeared first on Analytics Vidhya.
ArticleVideo Book This article was published as a part of the Data Science Blogathon. Introduction Tableau is a powerful DataVisualization software, and much. The post Building a Covid-19 Vaccination Dashboard in Tableau appeared first on Analytics Vidhya.
ArticleVideos Overview Merely building the model is not enough without stakeholders not being to interpret the outputs of your model In this article, understand. The post ML Interpretability using LIME in R appeared first on Analytics Vidhya.
ArticleVideo Book This article was published as a part of the Data Science Blogathon. “Understand your customer better, with data !!” ” Introduction Did you. The post Customer Loyalty Program with Python appeared first on Analytics Vidhya.
ArticleVideo Book This article was published as a part of the Data Science Blogathon. Introduction The majority of corporates or services rely highly upon. The post Classifying DDoS attacks with Artificial Intelligence appeared first on Analytics Vidhya.
ArticleVideos This article was published as a part of the Data Science Blogathon. Introduction A step-by-step guide to getting started with Seaborn! If matplotlib. The post A Beginner’s Guide To Seaborn: The Simplest Way to Learn appeared first on Analytics Vidhya.
This article was published as a part of the Data Science Blogathon. Introduction There have been many articles online showing how to connect R. The post Integrate R, Tableau and Excel appeared first on Analytics Vidhya.
ArticleVideo Book This article was published as a part of the Data Science Blogathon. Introduction Machine Learning is the trending digital technology in today’s world, The post Bar Chart Race of World Population by 2020 in Python appeared first on Analytics Vidhya.
This article was published as a part of the Data Science Blogathon. In this article, I will walk you through one technique that makes any machine learning model interpretable. Why does a Machine Learning Model need to be interpretable? The […].
ArticleVideo Book This article was published as a part of the Data Science Blogathon Introduction Image Source: Author Data Science enthusiasts know that raw data. The post Better EDA with 3 Easy Python Libraries for Any Beginner appeared first on Analytics Vidhya.
ArticleVideo Book This article was published as a part of the Data Science Blogathon. The post Mastering Exploratory Data Analysis(EDA) For Data Science Enthusiasts appeared first on Analytics Vidhya. Overview Step by Step approach to Perform EDA Resources Like.
We organize all of the trending information in your field so you don't have to. Join 42,000+ users and stay up to date on the latest articles your peers are reading.
You know about us, now we want to get to know you!
Let's personalize your content
Let's get even more personalized
We recognize your account from another site in our network, please click 'Send Email' below to continue with verifying your account and setting a password.


Let's personalize your content