This site uses cookies to improve your experience. To help us insure we adhere to various privacy regulations, please select your country/region of residence. If you do not select a country, we will assume you are from the United States. Select your Cookie Settings or view our Privacy Policy and Terms of Use.
Cookie Settings
Cookies and similar technologies are used on this website for proper function of the website, for tracking performance analytics and for marketing purposes. We and some of our third-party providers may use cookie data for various purposes. Please review the cookie settings below and choose your preference.
Used for the proper function of the website
Used for monitoring website traffic and interactions
Cookie Settings
Cookies and similar technologies are used on this website for proper function of the website, for tracking performance analytics and for marketing purposes. We and some of our third-party providers may use cookie data for various purposes. Please review the cookie settings below and choose your preference.
Strictly Necessary: Used for the proper function of the website
Performance/Analytics: Used for monitoring website traffic and interactions
Enterprises can drive next-level transformational outcomes using intelligent chatbots that integrate with their datawarehouses and dashboards, to provide actionable, easy to consume insights. With integrated intelligence, bots are now enmeshed with not just analytics dashboards, but they also interface with smart devices.
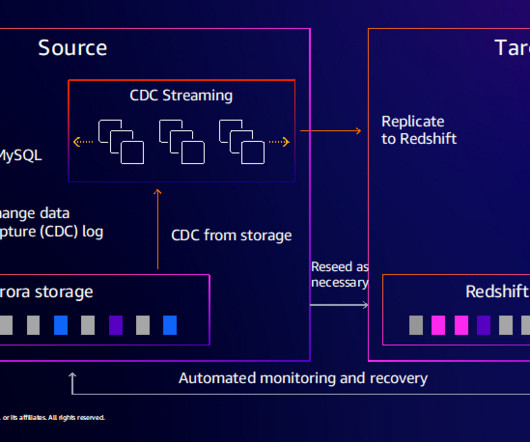
In this post, we look at three key challenges that customers face with growing data and how a modern datawarehouse and analytics system like Amazon Redshift can meet these challenges across industries and segments. The Stripe Data Pipeline is powered by the data sharing capability of Amazon Redshift.
To run analytics on their operational data, customers often build solutions that are a combination of a database, a datawarehouse, and an extract, transform, and load (ETL) pipeline. ETL is the process data engineers use to combine data from different sources.
In 2013, Amazon Web Services revolutionized the data warehousing industry by launching Amazon Redshift , the first fully-managed, petabyte-scale, enterprise-grade cloud datawarehouse. Amazon Redshift made it simple and cost-effective to efficiently analyze large volumes of data using existing business intelligence tools.
Identifying key use cases After a number of preparation meetings to discuss business and technical aspects of the use case, AWS and Altron identified two uses cases to resolve their two business challenges: Business intelligence for business-to-business accounts – Altron wanted to focus on their business-to-business (B2B) accounts and customer data.
This is SwipeGuide , a B2B cloud-based SaaS platform that captures and scales operational knowledge, helping teams in industrial environments to create, improve, and share instructions and standard operating procedures using mobile and wearable devices. “The
The elasticity of Kinesis Data Streams enables you to scale the stream up or down, so you never lose data records before they expire. Analytical data storage The next service in this solution is Amazon Redshift, a fully managed, petabyte-scale datawarehouse service in the cloud.
See the dashboards that Eric Wright FM uses to differentiate its services: >>Watch the the full on-demand webinar. Both of these dashboards integrated data from many locations, including outside sources such as the electric company. Watch Webinar. The team at Eric Wright FM Ltd. Watch Webinar.
When a majority of your budget is invested in tools and datawarehouses, rather than smart people to use them, you are saying you prefer to suck. Measurement models and data results are just "trophy wives / husbands" to you. You will almost die of happiness when the results come in. Embrace economic value.
Email campaign ideas, content improvement, behavior targeting, testing product prices , hiring a supposedly awesome consultant, using offline calls to action, measuring impact of television on the web, opening a twitter account of a B2B business, doing… Anything you can think of I can do it. Usually for free. Usually at least a test.
This includes cleaning, aggregating, enriching, and restructuring data to fit the desired format. Load : Once data transformation is complete, the transformed data is loaded into the target system, such as a datawarehouse, database, or another application. It facilitates smooth B2Bdata transmission.
Yet, inaccurate reporting due to unreliable or outdated data within SAP can paint a misleading picture. Additionally, inefficient dashboards and analytics hinder visibility into resource consumption patterns, making it difficult to pinpoint energy-intensive processes and implement resource-efficient measures.
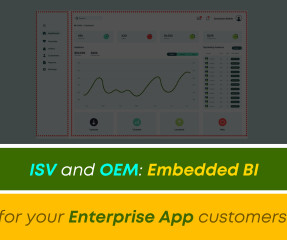
Embedded analytics makes analytics easier for the business user by bringing it closer to the user within a familiar or popular application or database environment and incorporating dashboards, graphs, charts, visualization to clarify results and make it easier for users to make decisions.
We organize all of the trending information in your field so you don't have to. Join 42,000+ users and stay up to date on the latest articles your peers are reading.
You know about us, now we want to get to know you!
Let's personalize your content
Let's get even more personalized
We recognize your account from another site in our network, please click 'Send Email' below to continue with verifying your account and setting a password.


Let's personalize your content