This site uses cookies to improve your experience. To help us insure we adhere to various privacy regulations, please select your country/region of residence. If you do not select a country, we will assume you are from the United States. Select your Cookie Settings or view our Privacy Policy and Terms of Use.
Cookie Settings
Cookies and similar technologies are used on this website for proper function of the website, for tracking performance analytics and for marketing purposes. We and some of our third-party providers may use cookie data for various purposes. Please review the cookie settings below and choose your preference.
Used for the proper function of the website
Used for monitoring website traffic and interactions
Cookie Settings
Cookies and similar technologies are used on this website for proper function of the website, for tracking performance analytics and for marketing purposes. We and some of our third-party providers may use cookie data for various purposes. Please review the cookie settings below and choose your preference.
Strictly Necessary: Used for the proper function of the website
Performance/Analytics: Used for monitoring website traffic and interactions
An important part of a successful business strategy is utilizing a modern data analysis tool and implementing a marketing report in its core procedures that will become the beating heart of acquiring customers, researching the market, providing detailed data insights into the most valuable information for any business: is our performance on track?
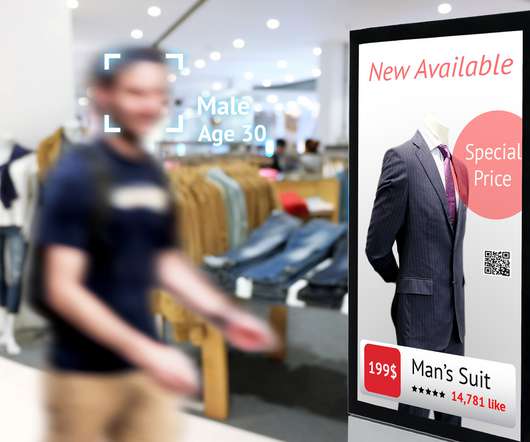
However, data analytics technology can be just as useful with regards to creating a successful B2B business. One of the benefits of data analytics in B2B marketing is with using digital signage. For B2B companies, digital signage may not be the first thing that comes to mind when developing a marketing strategy.
Getting your socially-driven affairs in order can seem like an impossible feat, but with social media reporting, you will be able to gain the insights you need to attain the results you deserve. When you add up modern technology and a professional report tool , your reporting processes in the social realm will reap many rewards.
The process helps businesses and decision-makers measure the success of their strategies toward achieving company goals. How does Company A measure the success of each individual effort so that it can isolate strengths and weaknesses? Key performance indicators enable businesses to measure their own ability to set and achieve goals.
However, if lead generation, reporting, and measuring ROI is important to your marketing team, then data normalization matters - a lot. Data normalization. It’s not a far stretch to suggest that the topic isn’t exactly what gets marketers excited in their day-to-day workflow.
In this post let's look at each Social Network, see what B2B and B2C brands are doing there today, from that draw lessons as to 1. For the rest of this post, I'm going to use the first three to capture the essence of social engagement and brand impact, and one to measure impact on the business. So, let's fix that error.
Key takeaways By implementing effective solutions for AI in commerce, brands can create seamless, personalized buying experiences that increase customer loyalty, customer engagement, retention and share of wallet across B2B and B2C channels. Today the technology’s advanced capabilities encourage widespread adoption.
I am going to break one of my unspoken cardinal rules: Only write about real problems and measurement that is actually possible in the real world. I am going to define a way for you to think about measuring social media, and you can't actually easily measure what I am going to recommend. So why not measure that?
For example, in regards to marketing, traditional advertising methods of spending large amounts of money on TV, radio, and print ads without measuring ROI aren’t working like they used to. 6) Smart and faster reporting. Consumers have grown more and more immune to ads that aren’t targeted directly at them. The results?
Today, many B2B companies use ABM teams or technologies to make sales. They’ll share what to consider when crafting an ABM strategy, from defining your ideal customer profile to crafting compelling messaging to measuring success. Account-based marketing (ABM) is a key strategy for driving sustainable growth.
If the Surface Marketing team is like every other team at every other company engaged in sponsorships and television advertising, it’ll measure the same collection of smart metrics like everyone else. The Surface team is likely measuring it with deep granularity (by individual games, geo, days, times of days, and a lot more).
It is increasingly common to find IoT devices, sensors that measure variables in a production process, etc., In comparison to a B2C marketing agency, a manufacturing marketing agency or a B2B marketing agency has a longer sale cycle in which benefits emerge gradually. Depending on the niche, marketing agencies often need more traffic.
Like any other marketing strategy, you must measure email performance. Digital workers measure almost anything they choose. “ Outcome analysis ” measures the effectiveness of your campaigns. This combination strategy is suitable for both B2B and B2C firms. For B2B businesses , form abandonment is a reality.
My normal recommendation to address this supremely corrosive issue is to encourage each company to go through the process of creating a Digital Marketing and Measurement Model. I'm not an expert in the credit score reporting business. My favorite report is the Credit Report Card. It is that simple. Sign up today!
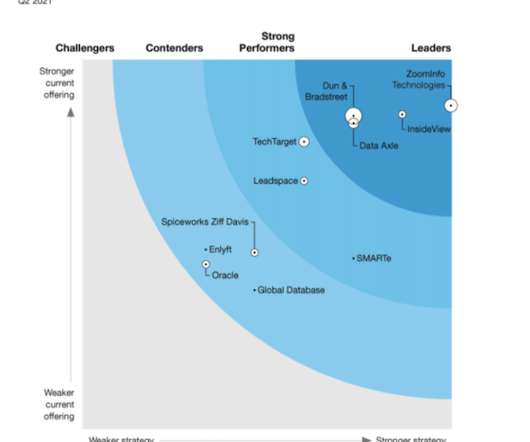
In our 24-criterion evaluation of B2B marketing data providers, we identified the 11 most significant vendors — Data Axle, Dun & Bradstreet, Enlyft, Global Database, InsideView, Leadspace, Oracle, SMARTe, Spiceworks Ziff Davis, TechTarget, and ZoomInfo Technologies — and researched, analyzed, and scored them.
Cropin Apps, as the name suggests, comprises applications that support global farming operations management, food safety measures, supply chain and “farm to fork” visibility, predictability and risk management, farmer enablement and engagement, advance seed R&D, production management, and multigenerational seed traceability.
In order to really ensure you are growing and making the most out of your data-driven efforts, it is necessary to implement measurable goals that will allow you to efficiently assess your strategic efforts. KPIs are a type of measurement that helps organizations evaluate their success in different activities and areas.
We have nine business units, some B2C and some B2B, but regardless of the business unit or customer, we use the same set of digital technologies across the enterprise. Our digital product organization, which reports into IT, is developing new solutions that both drive revenue and impact the market.
Product metrics are quantitative performance measurements used by businesses to gain insights into various areas like product development, pricing, quality, and more. They can evaluate architectural measures, quality measures, software complexity, or functional size. What Are Product Metrics?
I strongly encourage you to read the post and deeply understand all three and what your marketing and measurement possibilities and limitations are. The simplest way to start is to look at your Assisted Conversions report in Google Analytics. You can use the Top Conversion Paths report. But show the actual report.
The Thinkers360 B2B Thought Leadership Outlook Survey , for example, found that close to half of all respondents saw thought leadership adding over 75% to the brand premium they command in the marketplace. How you define, position, and report it will make all the difference.
After following a structured process to create a Web Analytics Measurement Model most companies find that they are able to identify the goals for their web business. One great benefit: I get detailed reports from Amazon that tell me clicks and conversion rates! Sorry, OOD. Let that sink in. Stunning, right? Two seconds of work there.
They base all computations in their standard reports on an awfully silly thing called last-click. Because the above picture actually looks like this… Suddenly most of your standard Adobe and Analytics reports are more than lying to you about the effectiveness of your marketing investments. I love this report.
Measuring compliance is a critical KPI for accountability. Even in the B2B space, customers demand that transactions are intuitive, easily fulfilled and within corporate policy. Are internal stakeholders following policies or going outside the system? Are suppliers meeting contract requirements, service levels and sustainability goals?
They are often measured on impressions (or worse, "connections") and clicks. Make sure that every single report you create has acquisition, behavior and outcome metrics (download this example: Page Efficiency Analysis Report ). Make sure you report your micro-conversion rate as well. many teams for acquisition.
Like most labels, “data-driven” is not a binary, black and white measure of capability. Cloudera worked with Experian , a global leader in consumer and business credit reporting which gathers, analyzes, combines and processes data on over one billion people and businesses.
The second was about predictive analytics and how using massive integrations between online and offline databases they had accomplished some really cool reporting of data (and make no doubt the IT work done over 18 months to accomplish this was cool). The days of tools and reports simply puking data out are rapidly reducing.
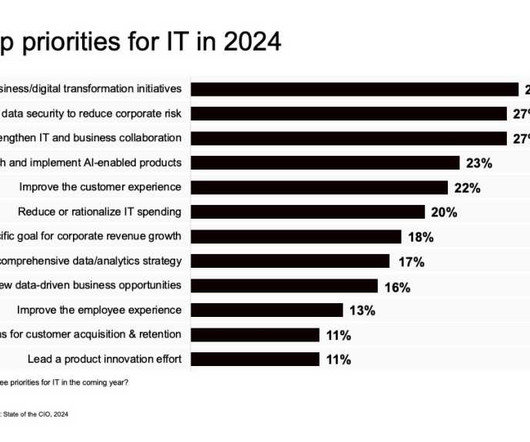
That work also ties into another CEO priority: growth as the company competes in both the B2B and B2C space. Other reports also highlight the strong CEO interest in AI. Extracting business value from AI Although most CEO priorities for CIOs look familiar, CEOs added a new objective to the 2024 list: AI, which debuted at No.
The SAP Business Network is the largest B2B network in the cloud. Here at SAP, we enable our customers to become Intelligent, Sustainable Enterprises by having connected business processes spanning the enterprise, including areas such as record to report, design to operate, hire to retire, order to cash, and many more.
The best WA report, segmentation, site search, SEO & PPC analysis, email, rich media, cookies, data sampling. Chapter 5 The Key to Glory: Measuring Success. If I have one jihad it is to massively convert every person who touches the web to focus on measuring Outcomes! I am out of breath! Glory will be yours!! Non-Ecommerce.
First, how we measure emissions and carbon footprint is about data design and policy. For example I would argue that most organizations that report their carbon footrest are not doing it consistently and nor are they doing it correctly. In other words, D&A plays a key role in the foundational measuring angle.
Although some product solutions disrupted the operational reporting market, they require users to know the questions they need to ask their data. 4] Gartner, Applied Infonomics: Use a Modern Data Catalog to Measure, Manage and Monetize Information Supply Chains , Published: 26 February 2018, Analyst(s): Alan D. We agree with that.
Using daily and/or weekly sales reports with your team may be the single most powerful action you can take to increase your team’s performance. And not just that, we will discuss the purpose and creation process so that you find out exactly what’s the story behind each report. What Is A Sales Report? Don’t believe us?
In just the past few months Alation has been recognized in: The Forrester Wave™: Data Governance Solutions , BARC’s Data Management Survey , the Constellation ShortList , the GigaOm Radar Report for Data Catalogs , Dresner Advisory Services’ 2021 Wisdom of Crowds® Data Catalog Market Study , and many, many more.
Reference data used to classify or categorize other data, including units of measure, codes, as well as controlled vocabularies of terms and taxonomies of topics. Using our semantic knowledge graph, you add quality and consistency to your data being delivered through the data fabric, making it easier to analyze and report on.
But why blame others, in this post let's focus on one important reason whose responsibility can be squarely put on your shoulders and mine: Measurement. Create a distinct mobile website and mobile app measurement strategies. Dive into Mobile Reporting and Analysis. Dive into Mobile Reporting and Analysis.
The very best analysts are comfortable operating with ambiguity and incompleteness, while all others chase perfection in implementation / processing / reports. That then takes us down the very best way to answer that question, to use the five-step process to build out the Digital Marketing and Measurement Model.
Hour-by-hour report please. :)? , I am having issues prioritizing 1) recommending fixing on site issues affecting real traffic levels versus 2) correcting significant configuration issues in Analytics measuring current site traffic. If there is anything you can measure, even with your broken analytics implementation, do that first.
How do you measure success of a online webinar? How do you measure SEO performance on a page level? Every measurement question should start by taking one step back and thinking of goals. Now it is not hard to figure out how to measure performance! Your KPI questions per attendee was off the chart! Back to our story.
Universal Analytics: T3: Measurement Protocol! No standard reports you can just go grab once you update your site code to analytics.js. Because you can do anything with the platform's features, how does one show specific reports/possibilities? Measurement Protocol – all your data are belong to us! They are: 1.
Yet our heroic efforts to report the aforementioned sexy metrics lead to little business action. Perhaps your client did not provide you with the all important Web Analytics Measurement Model. You: The person responsible for "providing data" / "analyzing metrics" / "reporting." That was success?
Reports to look at, KPIs to evaluate, inferences to make. It's as if they have never seen a report with Visits & Conversions before. Go to the B2B dancing monkey video (what!). Traffic Sources Report. The report I'll look at is the standard Visitor Loyalty report. Let's go!
Most companies are astonishingly blasé about data and possibilities of measurement. " Sad, unimaginative measurements of their sad, unimaginative campaigns. Don't brush off Twitter or Google+ because you are B2B or A2K. This blog is about the joys of measurement and the transformative power of data.
To learn more about the Do in stage one please review my See-Think-Do-Coddle framework for content, marketing and measurement.]. If you open your copy of Google/Adobe Analytics or CoreMetrics or Webtrekk you'll notice that every single report has a gigantic number of metrics in it. And… they have many reports!
We organize all of the trending information in your field so you don't have to. Join 42,000+ users and stay up to date on the latest articles your peers are reading.
You know about us, now we want to get to know you!
Let's personalize your content
Let's get even more personalized
We recognize your account from another site in our network, please click 'Send Email' below to continue with verifying your account and setting a password.


Let's personalize your content