This site uses cookies to improve your experience. To help us insure we adhere to various privacy regulations, please select your country/region of residence. If you do not select a country, we will assume you are from the United States. Select your Cookie Settings or view our Privacy Policy and Terms of Use.
Cookie Settings
Cookies and similar technologies are used on this website for proper function of the website, for tracking performance analytics and for marketing purposes. We and some of our third-party providers may use cookie data for various purposes. Please review the cookie settings below and choose your preference.
Used for the proper function of the website
Used for monitoring website traffic and interactions
Cookie Settings
Cookies and similar technologies are used on this website for proper function of the website, for tracking performance analytics and for marketing purposes. We and some of our third-party providers may use cookie data for various purposes. Please review the cookie settings below and choose your preference.
Strictly Necessary: Used for the proper function of the website
Performance/Analytics: Used for monitoring website traffic and interactions
“Without bigdata, you are blind and deaf and in the middle of a freeway.” – Geoffrey Moore, management consultant, and author. In a world dominated by data, it’s more important than ever for businesses to understand how to extract every drop of value from the raft of digital insights available at their fingertips.
While customers can perform some basic analysis within their operational or transactional databases, many still need to build custom data pipelines that use batch or streaming jobs to extract, transform, and load (ETL) data into their datawarehouse for more comprehensive analysis.
Amazon Redshift , launched in 2013, has undergone significant evolution since its inception, allowing customers to expand the horizons of data warehousing and SQL analytics. Industry-leading price-performance Amazon Redshift offers up to three times better price-performance than alternative cloud datawarehouses.
Amazon Redshift is a fast, scalable, secure, and fully managed cloud datawarehouse that lets you analyze your data at scale. Amazon Redshift Serverless lets you access and analyze data without the usual configurations of a provisioned datawarehouse. Choose a query to view it in Query profiler.
Amazon AppFlow automatically encrypts data in motion, and allows you to restrict data from flowing over the public internet for SaaS applications that are integrated with AWS PrivateLink , reducing exposure to security threats. He has helped customers build scalable data warehousing and bigdata solutions for over 16 years.
Now with Amazon Bedrock Knowledge Bases integration with structured data, you can use simple, natural language prompts to query complex financial datasets. Developers can rapidly implement sophisticated data querying features without complex codingjust connect to the API endpoints and let users explore financial data using plain English.
Organizations face various challenges with analytics and business intelligence processes, including data curation and modeling across disparate sources and datawarehouses, maintaining data quality and ensuring security and governance.
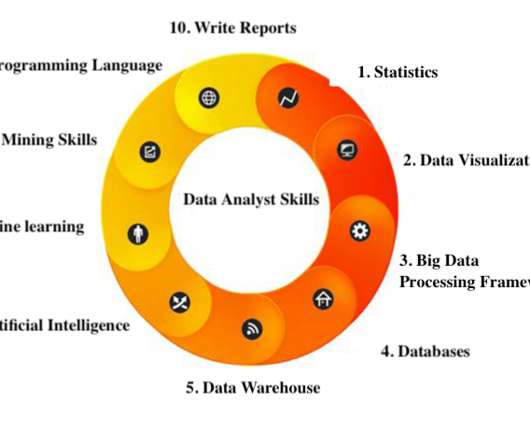
Data and bigdata analytics are the lifeblood of any successful business. Getting the technology right can be challenging but building the right team with the right skills to undertake data initiatives can be even harder — a challenge reflected in the rising demand for bigdata and analytics skills and certifications.
Unified access to your data is provided by Amazon SageMaker Lakehouse , a unified, open, and secure data lakehouse built on Apache Iceberg open standards. The final model provides sales teams with the highest-value opportunities, which they can visualize in a business intelligence dashboard and take action on immediately.
In the following section, two use cases demonstrate how the data mesh is established with Amazon DataZone to better facilitate machine learning for an IoT-based digital twin and BI dashboards and reporting using Tableau. This is further integrated into Tableau dashboards. This led to a complex and slow computations.
Amazon Redshift is a fast, scalable, secure, and fully managed cloud datawarehouse that you can use to analyze your data at scale. This enables you to integrate web-based applications to access data from Amazon Redshift using an API to run SQL statements. Building a serverless data processing workflow.
Piperr.io — Pre-built data pipelines across enterprise stakeholders, from IT to analytics, tech, data science and LoBs. Prefect Technologies — Open-source data engineering platform that builds, tests, and runs data workflows. Genie — Distributed bigdata orchestration service by Netflix.
Amazon Redshift is a fully managed, AI-powered cloud datawarehouse that delivers the best price-performance for your analytics workloads at any scale. To enable the feature, complete the following steps: On the Amazon Redshift console, open the Redshift Serverless dashboard. Choose Query data.
Amazon Redshift is a fully managed, petabyte-scale datawarehouse service in the cloud that delivers powerful and secure insights on all your data with the best price-performance. With Amazon Redshift, you can analyze your data to derive holistic insights about your business and your customers.
Ad hoc reporting, also known as one-time ad hoc reports, helps its users to answer critical business questions immediately by creating an autonomous report, without the need to wait for standard analysis with the help of real-time data and dynamic dashboards. The Benefits Of Ad Hoc Reporting And Analysis. Easy to use: .
Amazon Redshift Serverless makes it simple to run and scale analytics without having to manage your datawarehouse infrastructure. He works with customers and engineering teams to build new features that enable data engineers and data analysts to more easily load data, manage datawarehouse resources, and query their data.
Fortunately, there are a few quick fixes that you can try to help optimize looker performance and improve dashboard load times. 1 – Limit the number of dashboard elements. You can also use aggregate awareness to dramatically boost entire dashboards’ performance, which significantly improves load times.
Over the past 5 years, bigdata and BI became more than just data science buzzwords. Without real-time insight into their data, businesses remain reactive, miss strategic growth opportunities, lose their competitive edge, fail to take advantage of cost savings options, don’t ensure customer satisfaction… the list goes on.
We realized we needed a datawarehouse to cater to all of these consumer requirements, so we evaluated Amazon Redshift. At the same time, we had to find a way to implement entitlements in our Amazon Redshift datawarehouse with the same set of tags that we had already defined in Lake Formation.
The application supports custom workflows to allow demand and supply planning teams to collaborate, plan, source, and fulfill customer orders, then track fulfillment metrics via persona-based operational and management reports and dashboards. The following diagram illustrates the solution architecture.
Amazon Redshift is the most widely used datawarehouse in the cloud, best suited for analyzing exabytes of data and running complex analytical queries. Amazon QuickSight is a fast business analytics service to build visualizations, perform ad hoc analysis, and quickly get business insights from your data.
Their purpose is to help identify, develop and otherwise tap the value of bigdata and create opportunities for new strategic businesses. Specific business intelligence technologies may include: ad hoc analysis Data querying & discovery Datawarehouse Enterprise reporting Data visualization Dashboards.
SageMaker Lakehouse is a unified, open, and secure data lakehouse that now supports ABAC to provide unified access to general purpose Amazon S3 buckets, Amazon S3 Tables , Amazon Redshift datawarehouses, and data sources such as Amazon DynamoDB or PostgreSQL.
times better price-performance than other cloud datawarehouses on real-world workloads using advanced techniques like concurrency scaling to support hundreds of concurrent users, enhanced string encoding for faster query performance, and Amazon Redshift Serverless performance enhancements. Amazon Redshift delivers up to 4.9
AWS Glue has made this more straightforward with the launch of AWS Glue job observability metrics , which provide valuable insights into your data integration pipelines built on AWS Glue. With Grafana, you can create, explore, and share visually rich, data-driven dashboards. Lastly, configure the dashboard.
In today’s world, datawarehouses are a critical component of any organization’s technology ecosystem. They provide the backbone for a range of use cases such as business intelligence (BI) reporting, dashboarding, and machine-learning (ML)-based predictive analytics, that enable faster decision making and insights.
However, computerization in the digital age creates massive volumes of data, which has resulted in the formation of several industries, all of which rely on data and its ever-increasing relevance. Data analytics and visualization help with many such use cases. It is the time of bigdata. Select a Storage Platform.
Menurut saya, data analyst nampaknya cuma menganalisis data bisnis dan saya tidak tahu bagaimana cara meningkatkan skill saya.” Ini karena dia tidak sepenuhnya menggali nilai dari analisis bigdata. Software Pemvisualisasi Data: excel, python, software profesional lainnya. Data Warehous: SSIS, SSAS.
Large-scale datawarehouse migration to the cloud is a complex and challenging endeavor that many organizations undertake to modernize their data infrastructure, enhance data management capabilities, and unlock new business opportunities. This makes sure the new data platform can meet current and future business goals.
With quality data at their disposal, organizations can form datawarehouses for the purposes of examining trends and establishing future-facing strategies. Industry-wide, the positive ROI on quality data is well understood. Business/Data Analyst: The business analyst is all about the “meat and potatoes” of the business.
Tens of thousands of customers use Amazon Redshift for modern data analytics at scale, delivering up to three times better price-performance and seven times better throughput than other cloud datawarehouses. On the Amazon Redshift console, navigate to the Redshift Serverless dashboard. Choose Create workgroup.
This blog is intended to give an overview of the considerations you’ll want to make as you build your Redshift datawarehouse to ensure you are getting the optimal performance. dashboards), it can leave your consumers frustrated with their experience. So let’s dive in! OLTP vs OLAP. Cluster Performance Configurations.
BI tools access and analyze data sets and present analytical findings in reports, summaries, dashboards, graphs, charts, and maps to provide users with detailed intelligence about the state of the business. Business intelligence examples Reporting is a central facet of BI and the dashboard is perhaps the archetypical BI tool.
About Redshift and some relevant features for the use case Amazon Redshift is a fully managed, petabyte-scale, massively parallel datawarehouse that offers simple operations and high performance. It makes it fast, simple, and cost-effective to analyze all your data using standard SQL and your existing business intelligence (BI) tools.
This stack creates the following resources and necessary permissions to integrate the services: Data stream – With Amazon Kinesis Data Streams , you can send data from your streaming source to a data stream to ingest the data into a Redshift datawarehouse. version cluster. version cluster.
Grafana provides powerful customizable dashboards to view pipeline health. QuickSight makes it straightforward for business users to visualize data in interactive dashboards and reports. Sample AWS CDK template This post provides a sample AWS CDK template for a dashboard using AWS Glue observability metrics.
There are two broad approaches to analyzing operational data for these use cases: Analyze the data in-place in the operational database (e.g. With Aurora zero-ETL integration with Amazon Redshift, the integration replicates data from the source database into the target datawarehouse.
Analytics and data are becoming an integral part of every software product and every company. Activate Your Dashboard. 5 Advantages of Using a Redshift DataWarehouse. Whatever business you’re in, your company is becoming a data company. That means you need to put all that data somewhere. Sisense BloX 2.0:
HR&A has used Amazon Redshift Serverless and CARTO to process survey findings more efficiently and create custom interactive dashboards to facilitate understanding of the results. The following are sample screenshots of the dashboards that show survey responses by zip code.
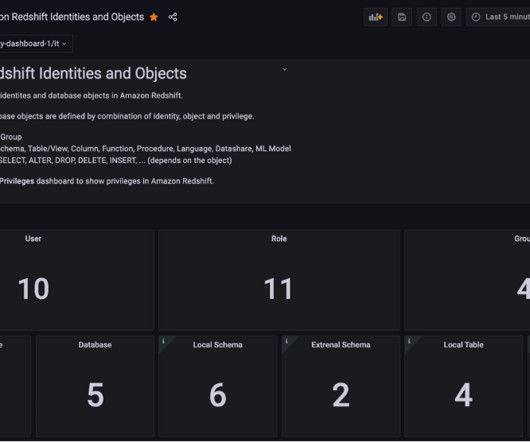
Amazon Redshift is a fully managed, petabyte-scale datawarehouse service in the cloud. Amazon Redshift enables you to use SQL for analyzing structured and semi-structured data with best price performance along with secure access to the data. Grafana provides a predefined dashboard to visualize database privileges.
This can include a multitude of processes, like data profiling, data quality management, or data cleaning, but we will focus on tips and questions to ask when analyzing data to gain the most cost-effective solution for an effective business strategy. Today, bigdata is about business disruption.
This could involve anything from learning SQL to buying some textbooks on datawarehouses. In a slightly more technically-driven role, a BI developer is responsible for building, creating, or improving BI-driven solutions that help analysts transform data into knowledge, including datadashboards.
Amazon Redshift is a fully managed, petabyte-scale datawarehouse service in the cloud. You can start with just a few hundred gigabytes of data and scale to a petabyte or more. On the provisioned snapshot dashboard, on the Restore snapshot menu, choose Restore to provisioned cluster or Restore to serverless namespace.
These solutions categorize and convert data into readable dashboards that anyone in a company can analyze. Data is reported from one central repository, enabling management to draw more meaningful business insights and make faster, better decisions. Modern data warehousing technology can handle all data forms.
We organize all of the trending information in your field so you don't have to. Join 42,000+ users and stay up to date on the latest articles your peers are reading.
You know about us, now we want to get to know you!
Let's personalize your content
Let's get even more personalized
We recognize your account from another site in our network, please click 'Send Email' below to continue with verifying your account and setting a password.


Let's personalize your content