This site uses cookies to improve your experience. To help us insure we adhere to various privacy regulations, please select your country/region of residence. If you do not select a country, we will assume you are from the United States. Select your Cookie Settings or view our Privacy Policy and Terms of Use.
Cookie Settings
Cookies and similar technologies are used on this website for proper function of the website, for tracking performance analytics and for marketing purposes. We and some of our third-party providers may use cookie data for various purposes. Please review the cookie settings below and choose your preference.
Used for the proper function of the website
Used for monitoring website traffic and interactions
Cookie Settings
Cookies and similar technologies are used on this website for proper function of the website, for tracking performance analytics and for marketing purposes. We and some of our third-party providers may use cookie data for various purposes. Please review the cookie settings below and choose your preference.
Strictly Necessary: Used for the proper function of the website
Performance/Analytics: Used for monitoring website traffic and interactions
2) What Is A Content Dashboard? 4) Content Dashboards Examples. As a content manager, you most likely spend most of your time writing quality blogs, email newsletters, and social media posts, all in an effort to ensure the business is growing and achieving its goals. What Is A Content Dashboard? Table of Contents.
A few years ago, I had encouraged a BI Director to create a BI dashboard showing the key financial metrics of their company and to show it to the CEO. Its not that finance people dont want or need BI dashboards, its that their needs are different to say someone in sales, marketing, operations or HR.
Let’s start by considering what KPIs are and what they mean in a business context. KPI is a value measured to assess how effective a project or company is at achieving its businessobjectives. Set up a report which you can visualize with an online dashboard. What Is A KPI? Consider your data sources.
Your data consumers are focused on businessobjectives. They need to grow sales, pursue new business opportunities, or reduce costs. What would it mean for a company to lead its industry in savvy and business agility? Impactful DataOps projects are those that help colleagues and executives pursue their objectives.
to brand mentions and platform traffic, all through the use of a marketing dashboard (or social media KPI dashboard, as it’s also known). To put this into perspective, a comprehensive Facebook dashboard will provide a birds-eye view of the most valuable social metrics you need to track. 2) Number of fans. 6) Viewer retention.
If what you are reporting does not align with the wider businessobjectives, you might end up driving the IT department – and sometimes even the rest of the business – further apart. That is a considerable asset to understand easily the bits and bytes of your activity and turn that data into informed business decisions.
Insights, businesses need to stay competitive and skyrocket their success. To help you get started with the topic, we put together this insightful guide on modern performance reporting using professional online dashboards. They enable users to evaluate if their efforts are resulting in the completion of crucial businessobjectives.
4) How to Select Your KPIs 5) Avoid These KPI Mistakes 6) How To Choose A KPI Management Solution 7) KPI Management Examples Fact: 100% of statistics strategically placed at the top of blog posts are a direct result of people studying the dynamics of Key Performance Indicators, or KPIs. What happens next?
Here, we’re going to explore the 14 most common types of reports in business and provide some examples of when to use them to your brand-boosting advantage. In addition, we will see how online dashboards have overthrown the static nature of classic reports and given way to a much faster, more interactive way of working with data.
Others are solely company-focused, and 11% of the primary players don’t even operate a blog, according to Callbox. Increasingly, companies across sectors operate critical parts of the businesses from their tablets or smartphones. Astonishingly low figures by all accounts.
I currently drive an Alfa Romeo Stelvio and, like most vehicles today, it notifies me on the dashboard when it is due for a service. Customers subscribed to the service have used it to sort out performance issues, corrupt universes and reports, set-up automated backups and recovery and build urgently required reports and dashboards.
KPIs are measurable values that show how effectively a company is achieving its businessobjectives. KPIs indicate areas businesses are on the right track and where improvements are needed. When implementing a BI strategy, it is crucial to consider the company’s individual strategy and align KPIs to the company’s objectives.
In just the last three days I received three fascinating dashboards. The second dashboard was from Google sending me a Google Maps Timeline update. The third dashboard was for monitoring the solar panels I just had installed on my house. It was pretty cool. times around the world. That was neat!
Beyond mere data collection, BI consulting helps businesses create a cohesive data strategy that aligns with organizational goals. This approach involves everything from identifying key metrics to implementing analytics systems and designing dashboards.
In a slightly more technically-driven role, a BI developer is responsible for building, creating, or improving BI-driven solutions that help analysts transform data into knowledge, including data dashboards. The role of a business intelligence engineer is incredibly rich, varied, and demanding.
Businesses need analytics-driven insights focused on their team’s performance as well as customer happiness levels to determine the strengths and weaknesses that affect their overall businessobjectives. These metrics are crucial to any business’s long-term success. Customer Satisfaction Metrics Dashboards.
From talent acquisition to performance management, there are a number of goals that an HR manager needs to prioritize every year that align with the organization’s overall businessobjectives. Read this blog post for a deeper dive into the basics. Start Building Your HR KPI Dashboard. How to Build Useful KPI Dashboards.
The same can be said when creating Business Intelligence dashboards. Four of the biggest challenges when building BI dashboards are: Scalability. They had tried building a comprehensive BI dashboard first using Microstrategy, then Tableau and then PowerBI but all had design, mobile, scalability and performance challenges.
BI dashboards can be designed the same way and using infographics which are a little unconventional can really help improve the adoption and effectiveness of your BI applications. We saw this at the InfoSol Dashboard Awards at last year’s IBIS with the UAE Ministry of Health performance and clinical excellence dashboard.
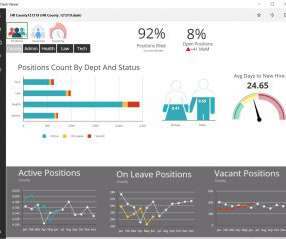
One of the highlights of IBIS was the InfoSol 2018 Best BI Dashboards Awards. Dashboards continue to be the primary interface of most business intelligence solutions. Best BusinessDashboard Award. The InfoSol 2018 Best BusinessDashboard Award went to The Waldinger Corporation for their Technician Dashboard.
At the IBIS 2018 BusinessObjects event in June, there were a lot of people asking about the future of BusinessObjects Dashboards (aka Xcelsius). years away), SAP has said that it will no longer support BusinessObjects Dashboards after that date. and above enables the generation of HTML5 Xcelsius dashboards both on desktop and mobile.
I experienced so many eye-opening presentations, inspiring sessions and great conversations that I was not sure where to start with this blog to condense it all down to the main takeaways. So, as you clicked on each State in the Tableau dashboard, it would bring up detailed related Webi data in another component on the dashboard.
Business users are suffering from serious SaaS fatigue. It isn’t uncommon for a business user to see something on a dashboard that intrigues them and submit a request to the BI team for that data. Subscribe to Alation's Blog. Companies with 2,000+ employees have an average of 175 applications.
FALSE There are multiple facets to this each justifying a full blog of its own, but I will try to summarize it as follows. The only viable way to replace BusinessObjects reports and dashboards is to re-create them in the new tool. Myth Number 3: Organizations believe they can save money by replacing BusinessObjects.
Slow requirements led technology leaders to demand proactive business intelligence. As BusinessObjects founder Bernard Liautaud notes in e-Business Intelligence: Turning Information Into Knowledge Into Profit (McGraw-Hill, 2001), the lack of ad hoc data access causes IT staff to drown in requests.
While this may sound like an unreal possibility, one could relate to this thought better if one were to ponder over David Fano’s (Chief Growth Officer, WeWork) words, “Basically, every object will have the potential to be a computer”. . This can be used to better prioritize deals to pursue within a quarter.
So, for Part 4 of this blog series, I would like to review how you can leverage BusinessObjects to enable and accelerate tools like PowerBI. . This will not only save a lot of time, resources and expense, but it will also help to get PowerBI dashboards and applications rolled out quicker and accelerate end-user adoption.
For eCommerce site X, Conversion Rate might be a KPI because their current objectives are tied to reversing key business trends. The key is knowing what your businessobjectives are. " Recently I had the opportunity to cover the IABI in a significant amount of detail in my blog post on creating strategic dashboards.
Everything runs seamlessly and efficiently and all stakeholders are aware of the cloud’s potential to drive businessobjectives. No automation: Security professionals identify and address incidents and problems manually through dashboards.
Building Dashboards in Webi nicely broken up into 2-hour standalone modules, there will be 90 seminar sessions in five different tracks including BusinessObjects Administration and Universe Design, BI Reporting, BI Dashboards and Data Visualization, InfoBurst, Customer Case studies and BI innovations. BO and Tableau Integration.
We knew we needed to pull together a leadership dashboard to show all of the given campaigns in real-time.” Today, it is regarded internally as a transformational business technology used by 6000+ employees as part of a content marketing strategy to achieve businessobjectives.
In Part 1 of this blog, we reviewed the top 5 main differentiators between BusinessObjects Web Intelligence and PowerBI, as determined by 2 different independent BI consultants who have worked and continue to work extensively with both tools. Reporting and “dashboarding” become a separate exercise and very hard to connect.
Web Intelligence, IDT Universe Design, BusinessObjects administration, Dashboard design and data visualization. The InfoSol 2020 Dashboard Awards. Dashboard Design Surgery with top UI design experts. Wednesday June 24: BI Dashboards and Data Visualization. Creating Webi Dashboards. Like a Pro.
Business Intelligence (BI) encompasses a wide variety of tools, applications and methodologies that enable organizations to collect data from internal systems and external sources, process it and deliver it to business users in a format that is easy to understand and provides the context needed for informed decision making.
Business Intelligence (BI) encompasses a wide variety of tools, applications and methodologies that enable organizations to collect data from internal systems and external sources, process it and deliver it to business users in a format that is easy to understand and provides the context needed for informed decision making.
By building on our existing portfolio of business intelligence (BI) and planning analysis solutions, our clients are transcending manual and siloed analysis processes to optimize financial targets, sales goals, and operational capacity requirements. In doing so, they are putting their data to work to better meet their businessobjectives.
As more industries mature digitally and widely adopt AI and machine learning technologies, 2023 will be a pivotal year for organizations looking to deploy emerging tech solutions company-wide to fulfill businessobjectives. 1- Treating data as a strategic business asset .
Start by picking a few key performance indicators (KPIs) related to your businessobjectives and other industry benchmarks that you want to evaluate and use to make decisions. Make sure you and your colleagues test-drive the dashboards and other means of interacting with data (widgets, apps, etc.) Start small!
Developers, IT and business management teams determine what metrics are most useful to track to maintain a level of application performance that meets businessobjectives. PromQL allows developers and IT departments to aggregate data metrics and turn them into histograms–graphs and dashboards for greater visualization.
User-friendliness: The software should be easy to use, with intuitive dashboards and user interfaces. By following these steps and taking the time to evaluate your options thoroughly, you’ll increase the chances of selecting an MES software that aligns with your businessobjectives and contributes to your manufacturing success.
Firstly, Web Intelligence will have further data visualization and dashboarding capabilities and a further enhanced user interface. There will be a slew of new visualizations from the UI5 library now included. Components like scrollable tables and integration with Google maps to create almost any type of visualization.
Because most IT environments do not virtualize 100% of their workloads, a hybrid environment—one containing both hyperconverged and composable infrastructures—can be a major asset to some businesses. These kinds of hybrid environments allow users to leverage the advantages of each type of infrastructure where it benefits their business most.
allows you to create a master Webi document and then place a universe on top of this document to enable users to create child reports, dashboards and extracts from this one master document. This feature that came out with the first release of BI 4.3
To capture the most value from hybrid cloud, business and IT leaders must develop a solid hybrid cloud strategy supporting their core businessobjectives. These include single consoles or dashboards that help create a single pane of glass (SPOG) so teams can easily view and control resources.
We organize all of the trending information in your field so you don't have to. Join 42,000+ users and stay up to date on the latest articles your peers are reading.
You know about us, now we want to get to know you!
Let's personalize your content
Let's get even more personalized
We recognize your account from another site in our network, please click 'Send Email' below to continue with verifying your account and setting a password.


Let's personalize your content