This site uses cookies to improve your experience. To help us insure we adhere to various privacy regulations, please select your country/region of residence. If you do not select a country, we will assume you are from the United States. Select your Cookie Settings or view our Privacy Policy and Terms of Use.
Cookie Settings
Cookies and similar technologies are used on this website for proper function of the website, for tracking performance analytics and for marketing purposes. We and some of our third-party providers may use cookie data for various purposes. Please review the cookie settings below and choose your preference.
Used for the proper function of the website
Used for monitoring website traffic and interactions
Cookie Settings
Cookies and similar technologies are used on this website for proper function of the website, for tracking performance analytics and for marketing purposes. We and some of our third-party providers may use cookie data for various purposes. Please review the cookie settings below and choose your preference.
Strictly Necessary: Used for the proper function of the website
Performance/Analytics: Used for monitoring website traffic and interactions
Audio classification is an Application of machine learning where different sound is categorized in certain categories. In our previous blog, we have studied Audio classification using ANN and build a model from scratch. The post Music Genre Classification Project Using Machine Learning Techniques appeared first on Analytics Vidhya.
Zero-ETL integration with Amazon Redshift reduces the need for custom pipelines, preserves resources for your transactional systems, and gives you access to powerful analytics. In this post, we explore how to use Aurora MySQL-Compatible Edition Zero-ETL integration with Amazon Redshift and dbt Cloud to enable near real-time analytics.
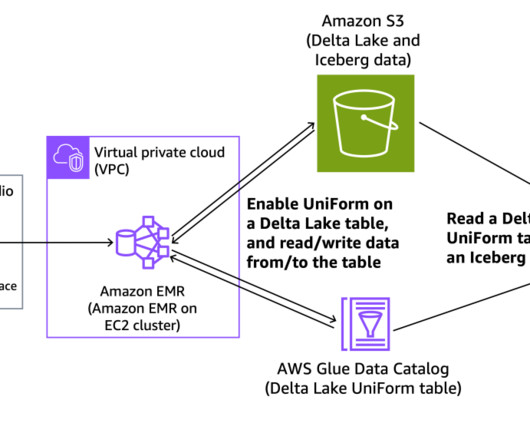
This expands data access to broader options of analytics engines. According to its usage expansion, this company wants to expand data access to cloud-based data warehouses such as Amazon Redshift for flexible analytics use cases. Enter delta-lake-uniform-blog-post in Name and confirm choosing emr-7.3.0 Choose Create cluster.
That being said, in this post, we will explain what is a dashboard in business, the features of strategic, tactical, operational and analytical dashboards, and expound on examples that these different types of dashboards can be used. Determining which overarching category your dashboard sits in is the first order of business.
1) What Is Business Intelligence And Analytics? If someone puts you on the spot, could you tell him/her what the difference between business intelligence and analytics is? We already saw earlier this year the benefits of Business Intelligence and Business Analytics. What Is Business Intelligence And Analytics?
The answer is modern agency analytics reports and interactive dashboards. In this article, we will cover every fundamental aspect to take advantage of agency analytics. Let’s dig in with the definition of agency analytics. Your Chance: Want to test a powerful agency analytics software? What Are Agency Analytics?
Exclusive Bonus Content: Ready to use data analytics in your restaurant? In a previous study into big data examples in real life, we explored how the catering industry could benefit from the use of restaurants analytics – a topic that we’re going to delve deeper into here. What Are Restaurant Analytics?
2) Pros & Cons Of Bar Charts 3) When To Use A Bar Graph 4) Types Of Bar Charts 5) Bar Graphs & Charts Best Practices 6) Bar Chart Examples In today’s fast-paced analytical landscape, data visualization has become one of the most powerful tools organizations can benefit from to be successful with their analytical efforts.
Analytical: These particular dashboards contain large streams of comprehensive data that allow analysts to drill down and extract insights to help the company to progress at an executive level. Choose bar charts if you want to quickly compare items in the same category, for example, page views by country. click to enlarge**.
In his article “ Machine Learning for Product Managers ,” Neal Lathia distilled ML problem types into six categories: ranking, recommendation, classification, regression, clustering, and anomaly detection. Avinash Kaushik’s Web Analytics 2.0 is an excellent introduction to metrics and analytics. Conclusion.
More companies are using data analytics and AI to optimize their marketing strategies. You can use their sophisticated analytics dashboard to improve your marketing strategies. You can use their sophisticated analytics dashboard to improve your marketing strategies. Sprout Social has a blog post on accomplishing this.
Over the years of working with data analytics teams in large and small companies, we have been fortunate enough to observe hundreds of companies. Most data teams fall into this data-centric category, plagued by unclear data updates, inconsistent quality, and fragmented processes.
This example shows additional information for the net profit: the top 5 product categories by using a drill-through. Sometimes referred to as nested charts, they are especially useful in tables, where you can access additional drilldown options such as aggregated data for categories/breakdowns (e.g. 8) Advanced Data Options.
The 80/20 rule applies to our use of web analytics tools as well. I recommend that periodically you gather folks around you for lunch, pull up Adobe Analytics on the big screen in the conference room, let each person expose one hidden report or feature. Google Analytics Shortcuts: Save Your Complex Views. This hurts my feelings!
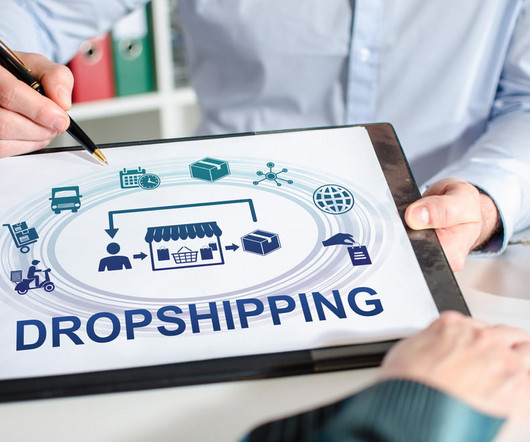
Paul Glen of IBM’s Business Analytics wrote an article titled “ The Role of Predictive Analytics in the Dropshipping Industry.” ” Glen shares some very important insights on the benefits of utilizing predictive analytics to optimize a dropshipping commpany. The dropshipping industry is among them.
By asking the right questions, utilizing sales analytics software that will enable you to mine, manipulate and manage voluminous sets of data, generating insights will become much easier. This genie (who we’ll call Data Dan) embodies the idea of a perfect data analytics platform through his magic powers. Direct comparison is possible.
Read the complete blog below for a more detailed description of the vendors and their capabilities. Because it is such a new category, both overly narrow and overly broad definitions of DataOps abound. Process Analytics. Dagster / ElementL — A data orchestrator for machine learning, analytics, and ETL. .
Analytics technology is very important for online businesses. You need to pay close attention to analytics data on various KPIs to determine whether your strategy is working well and what tweaks need to be made. Factors to Evaluate with Your Analytics Data. Google searches, blog links, direct URL type-ins, etc.)
Our list of Top 10 Data Lineage Podcasts, Blogs, and Websites To Follow in 2021. Throughout each episode, hosts Shane and Nigel discuss how to incorporate agile techniques when teams deliver analytics, data, and visualizations. The post Top 10 Data Lineage Podcasts, Blogs, and Magazines appeared first on Octopai. Agile Data.
The world of digital analytics seems to be insanely complicated. I led a discussion the other day with a collection of people who were brand new to the space and some who were jaded long-term residents of Camp Web Analytics. Digital Analytics Ecosystem: The Inputs. Digital Analytics Ecosystem: The Outputs. Let's go!
It’s implications are far and wide, even in the narrow scope that I live in (marketing, analytics, influence). Machine Learning | Analytics. Machine Learning | Analytics. More and more humans are going to be transitioned out of the business of analytics. Here are the elements I’ll cover: + AI | Now | Local Maxima. +
COVID-19 is a huge data story in many ways, and food delivery analytics are a big part of that. Personica and other software providers are making infusing analytics into internal workflows a possibility for restaurants of all kinds. Discover retail analytics. However there’s hope on the horizon!
As we have already talked about in our previous blog post on sales reports for daily, weekly or monthly reporting, you need to figure out a couple of things when launching and executing a marketing campaign: are your efforts paying off? 1) Web Analytics Report. 1) Blog Traffic And Blog Leads Report. click to enlarge**.
From automated reporting, predictive analytics, and interactive data visualizations, reporting on data has never been easier. Drill down is an analytical practice that allows you to visualize granular levels of data in one chart. Your Chance: Want to start building your own interactive reports today? What Is A Drill Down?
2) When To Use Spider Graphs 3) Types Of Radar Charts 4) Radar Graph Best Practices 5) Spider Chart Examples If you are reading this blog post then you must be somewhat aware of the value of data visualization. Table of Contents 1) What Is A Spider Chart? Hence, why they are also known as star charts. Let’s look at some of them.
2) Charts And Graphs Categories 3) 20 Different Types Of Graphs And Charts 4) How To Choose The Right Chart Type Data and statistics are all around us. Below we will discuss the graph and chart categories. These categories will build a solid foundation that will help you pick the right visual for your analytical aims.
The weekly analytics didn’t build correctly. Analytics, in the modern enterprise, span toolchains, teams, and data centers. It enables all of the stakeholders to view the real-time status of analytics build operations. Build Types are: Analytic – analytic products like star schemas and data marts for end-users.
Data interpretation refers to the process of using diverse analytical methods to review data and arrive at relevant conclusions. While there are several different types of processes that are implemented based on individual data nature, the two broadest and most common categories are “quantitative analysis” and “qualitative analysis”.
How to measure your data analytics team? So it’s Monday, and you lead a data analytics team of perhaps 30 people. Like most leaders of data analytic teams, you have been doing very little to quantify your team’s success. Introduction. You’ve got a new boss. And she is numbers driven – great! Forty-five metrics!
A business-disruptive ChatGPT implementation definitely fits into this category: focus first on the MVP or MLP. These rules are not necessarily “Rocket Science” (despite the name of this blog site), but they are common business sense for most business-disruptive technology implementations in enterprises.
As companies striving to embrace digital transformation and become data-driven, business intelligence and analytics skills and experience are essential to building a data-savvy team. However, if someone puts you on the spot, can you clearly tell the difference between business intelligence and analytics? Business Analytics.
As a content manager, you most likely spend most of your time writing quality blogs, email newsletters, and social media posts, all in an effort to ensure the business is growing and achieving its goals. This most insightful of Google Analytics dashboards provide the perfect mix between overview metrics and more detailed insights.
there are two answers that go hand in hand: good exploitation of your analytics, that come from the results of a market research report. With an NPS Score, customers are split into three categories: promoters (those scoring your service 9 or 10), passives (those scoring your service 7 or 8), and detractors (those scoring your service 0 to 6).
This journey involves the exploration of various analyticscategories, each with its unique purpose and complexity. The post Unlocking the Power of Analytics: From Diagnostic to Cognitive appeared first on Data Management Blog - Data Integration and Modern Data Management Articles, Analysis and Information.
Enterprise data is brought into data lakes and data warehouses to carry out analytical, reporting, and data science use cases using AWS analytical services like Amazon Athena , Amazon Redshift , Amazon EMR , and so on. These data processing and analytical services support Structured Query Language (SQL) to interact with the data.
In this post, we will examine ways that your organization can separate useful content into separate categories that amplify your own staff’s performance. If you include the title of this blog, you were just presented with 13 examples of heteronyms in the preceding paragraphs. Before we start, I have a few questions for you.
This is where harnessing artificial intelligence (AI) and data analytics can help. Companies that harness AI and data analytics can also make clean energy more viable overall by increasing their cost competitiveness over legacy energy sources. On average, 3.3 The latter can also help drive efficiency by lowering end-user energy use.
64% of the respondents took part in training or obtained certifications in the past year, and 31% reported spending over 100 hours in training programs, ranging from formal graduate degrees to reading blog posts. The tools category includes tools for building and maintaining data pipelines, like Kafka. Salaries by Tool and Platform.
Read more about the Data for Enterprise AI category here . Read more about the Data for Good category here . Read more about the Data Lifecycle Connection category here . Read more about the Data Security and Governance category here . Read more about the Hybrid and Multi-Cloud category here . ExxonMobil .
2024 Gartner Market Guide To DataOps We at DataKitchen are thrilled to see the publication of the Gartner Market Guide to DataOps, a milestone in the evolution of this critical software category. DataOps is at the intersection of many different product categories. One way to look at this is as a Venn diagram.
Savvy organizations know they don’t need to fear data and analytics — they see better insights as the pathway to a brighter future. She has over 5 years of experience in the technology industry, helping thousands of organizations transform their business with data and analytics.
The performance data you can use on the Amazon Redshift console falls into two categories: Amazon CloudWatch metrics – Helps you monitor the physical aspects of your cluster or serverless, such as resource utilization, latency, and throughput. She is passionate about helping customers build scalable and robust data and analytics solutions.
To help eradicate that knowledge gap, at datapine, we are putting together a series of blog posts that do a deep dive into each type of graph and chart with their most common use cases and a list of examples and best practices. In this case, the area graph is elevated by adding secondary axes with an additional category.
In a previous blog , I explored the value of dark data and how it can reveal insights that can streamline processes, improve customer experiences, generate more revenue – and maybe even help make the world a better place. Going back to a core theme from my last blog, the best detectors of valuable data are people. Aggregate and pool.
We organize all of the trending information in your field so you don't have to. Join 42,000+ users and stay up to date on the latest articles your peers are reading.
You know about us, now we want to get to know you!
Let's personalize your content
Let's get even more personalized
We recognize your account from another site in our network, please click 'Send Email' below to continue with verifying your account and setting a password.


Let's personalize your content