This site uses cookies to improve your experience. To help us insure we adhere to various privacy regulations, please select your country/region of residence. If you do not select a country, we will assume you are from the United States. Select your Cookie Settings or view our Privacy Policy and Terms of Use.
Cookie Settings
Cookies and similar technologies are used on this website for proper function of the website, for tracking performance analytics and for marketing purposes. We and some of our third-party providers may use cookie data for various purposes. Please review the cookie settings below and choose your preference.
Used for the proper function of the website
Used for monitoring website traffic and interactions
Cookie Settings
Cookies and similar technologies are used on this website for proper function of the website, for tracking performance analytics and for marketing purposes. We and some of our third-party providers may use cookie data for various purposes. Please review the cookie settings below and choose your preference.
Strictly Necessary: Used for the proper function of the website
Performance/Analytics: Used for monitoring website traffic and interactions
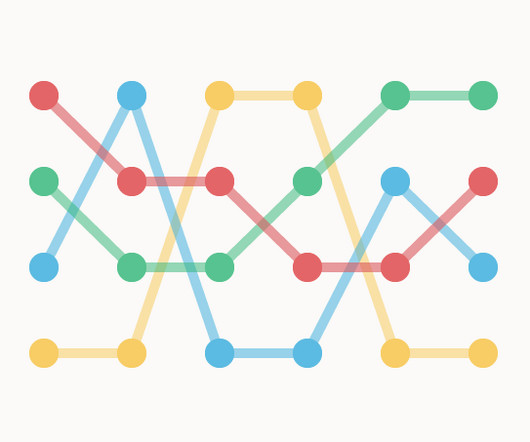
A Bump Chart is a visualisation that shows how the rankings of different categories or entities change over time or between groupings. Each category or entity is represented by a connected line that “bump” up or down as their rankings change over time. Colour is often used to distinguish each category.
64% of the respondents took part in training or obtained certifications in the past year, and 31% reported spending over 100 hours in training programs, ranging from formal graduate degrees to reading blog posts. Other less common languages associated with high salaries were Erlang, Julia, Swift, and F#. See Figure 4 for the full list.
And my favorite topic: what are some of the best books, blogs, podcasts, etc., or Julia (winner of 2018 Wilkinson prize ), most people are focusing on Python for introduction to data science. There are oh-so-many good blogs about data science, and one of my top picks is the go-to site for data visualization, Flowingdata.
This blog post provides a concise session summary, a video, and a written transcript. It may be that for people in the former category, if they don’t level up to it, well, there are some good construction jobs. Paco Nathan presented, “Data Science, Past & Future” , at Rev. Session Summary.
We organize all of the trending information in your field so you don't have to. Join 42,000+ users and stay up to date on the latest articles your peers are reading.
You know about us, now we want to get to know you!
Let's personalize your content
Let's get even more personalized
We recognize your account from another site in our network, please click 'Send Email' below to continue with verifying your account and setting a password.


Let's personalize your content