This site uses cookies to improve your experience. To help us insure we adhere to various privacy regulations, please select your country/region of residence. If you do not select a country, we will assume you are from the United States. Select your Cookie Settings or view our Privacy Policy and Terms of Use.
Cookie Settings
Cookies and similar technologies are used on this website for proper function of the website, for tracking performance analytics and for marketing purposes. We and some of our third-party providers may use cookie data for various purposes. Please review the cookie settings below and choose your preference.
Used for the proper function of the website
Used for monitoring website traffic and interactions
Cookie Settings
Cookies and similar technologies are used on this website for proper function of the website, for tracking performance analytics and for marketing purposes. We and some of our third-party providers may use cookie data for various purposes. Please review the cookie settings below and choose your preference.
Strictly Necessary: Used for the proper function of the website
Performance/Analytics: Used for monitoring website traffic and interactions
64% of the respondents took part in training or obtained certifications in the past year, and 31% reported spending over 100 hours in training programs, ranging from formal graduate degrees to reading blog posts. Salaries by Programming Language. Salary vs. programming language. Salaries by Gender. How do we explain this?
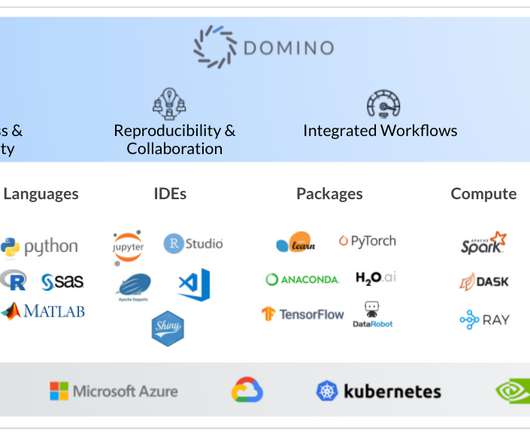
While there are certainly engineers and scientists who may be entrenched in one camp or another (the R camp vs. Python, for example, or SAS vs. MATLAB), there has been a growing trend towards dispersion of data science tools. They may be GUI based or require extensive programming experience. Types of Data Science Tools. Data Languages.
Read the complete blog below for a more detailed description of the vendors and their capabilities. Because it is such a new category, both overly narrow and overly broad definitions of DataOps abound. Reflow enables scientists and engineers to compose existing tools (packaged in Docker images) using ordinary programming constructs.
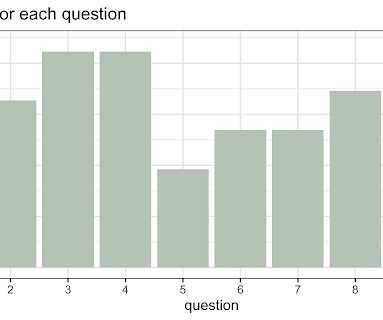
After consuming a number of YouTube videos, blog posts, articles, and playing around with ChatGPT, I felt the need to write down my thoughts and observations on the topic. Point #3 is kind of pointless or badly written because the category names should already be in the category axis.
Besides strong technical skills (for instance, use of Hadoop, programming in R and Python , math, statistics), data scientists should also be able to tackle open-ended questions and undirected research in ways that bring measurable business benefits to their organization. We live in a constantly-evolving world of data.
We are excited to be launching our first awards program together as the “New Cloudera.” Although the program is technically in its seventh year, as the first joint awards program, this year’s Data Impact Awards will span even more use cases, covering even more advances in IoT, data warehouse, machine learning, and more.
The groups for the illustration can be broadly classified into the following categories: Regional sales managers will be granted access to view sales data only for the specific country or region they manage. For instance, the AMER North American Sales Manager will only see sales data related to North America.
R will produce these quite easily but, sadly, few other tools do the same. Stem & leaf plots in their natural habitat : Japanese train departures A paper looking at the impact of adventure programs in education Bean/Violin Plot. It is most effective with a small number of categories. SUBSCRIBE TO OUR BLOG.
On this blog, you’ve seen numerous attempts by me to remedy the dilemma. Action #1: Analytics Program Maturity Diagnostic. Which quadrant reflects the maturity of your analytics program? Roughly compute what percentage of the team’s time was spent in each category. Enough theory, time to some real, sexy, work.
In Paco Nathan ‘s latest column, he explores the theme of “learning data science” by diving into education programs, learning materials, educational approaches, as well as perceptions about education. Where are the leading educational programs in data science? Introduction. for beginning study in data science?
” That being said, you’ve got to use some software program. Learn about scaling, shading, collapsing categories, and building diverging or small multiples charts. Module 8: Select a Software Program (12 lessons; 21 min). ” That being said, you’ve got to use some software program.
This blog post shares a set of questions that were answered by Google data scientists and how they did. Defining "Data Scientist" If you look through job listings at Google for data scientists , you will find a role called Data Scientist - Research (DS-R for short). Both work in the DS-R role that is the main focus of this post.
We organize all of the trending information in your field so you don't have to. Join 42,000+ users and stay up to date on the latest articles your peers are reading.
You know about us, now we want to get to know you!
Let's personalize your content
Let's get even more personalized
We recognize your account from another site in our network, please click 'Send Email' below to continue with verifying your account and setting a password.


Let's personalize your content