This site uses cookies to improve your experience. To help us insure we adhere to various privacy regulations, please select your country/region of residence. If you do not select a country, we will assume you are from the United States. Select your Cookie Settings or view our Privacy Policy and Terms of Use.
Cookie Settings
Cookies and similar technologies are used on this website for proper function of the website, for tracking performance analytics and for marketing purposes. We and some of our third-party providers may use cookie data for various purposes. Please review the cookie settings below and choose your preference.
Used for the proper function of the website
Used for monitoring website traffic and interactions
Cookie Settings
Cookies and similar technologies are used on this website for proper function of the website, for tracking performance analytics and for marketing purposes. We and some of our third-party providers may use cookie data for various purposes. Please review the cookie settings below and choose your preference.
Strictly Necessary: Used for the proper function of the website
Performance/Analytics: Used for monitoring website traffic and interactions
Our survey focused on how companies use generative AI, what bottlenecks they see in adoption, and what skills gaps need to be addressed. As of November 2023: Two-thirds (67%) of our survey respondents report that their companies are using generative AI. And only 33% report that their companies aren’t using AI at all.
Bridging the Gap: How ‘Data in Place’ and ‘Data in Use’ Define Complete Data Observability In a world where 97% of data engineers report burnout and crisis mode seems to be the default setting for data teams, a Zen-like calm feels like an unattainable dream.
Observability is a methodology for providing visibility of every journey that data takes from source to customer value across every tool, environment, data store, team, and customer so that problems are detected and addressed immediately. to monitor your data operations. This solution sits on top of your existing infrastructure?without
I worry about data’s last-mile gap a lot. As a lover of data-influenced decision making, perhaps you worry as well. The last-mile gap is the distance between your trends and getting an influential company leader to take action. Your biggest asset in closing that last-mile gap is the way you present the data.
A DataOps Engineer owns the assembly line that’s used to build a data and analytic product. We find it helpful to think of data operations as a factory. We find it helpful to think of data operations as a factory. Most organizations run the data factory using manual labor. Figure 1: Ford assembly line, 1913.
1) What Is Data Interpretation? 2) How To Interpret Data? 3) Why Data Interpretation Is Important? 4) Data Analysis & Interpretation Problems. 5) Data Interpretation Techniques & Methods. 6) The Use of Dashboards For Data Interpretation. Business dashboards are the digital age tools for big data.
About the report. The Cloudera Enterprise Data Maturity Report is a global survey of 3,150 business and IT decision makers assessing organizations’ maturity when it comes to their current capabilities and handling of data and analytics.
First… it is important to realize that big data's big imperative is driving big action. 12: Almost all reporting is off custom reports. #11: 7: 25% of all analytical effort is dedicated to data visualization/enhancing data's communicative power. #6: Reporting Squirrels vs. Analysis Ninjas.
But the data suggests a significant gap between these aspirations and the reality. Defining the skills and accessibility gap. According to the research , the majority of companies acknowledge the strategic importance of data analytics, but they aren’t making analytics widely accessible or easy to use for their workers.
erwin by Quest just released the “2021 State of Data Governance and Empowerment” report. Today, data needs to fuel rapid decisions that make an organization more effective, customer-centric and competitive. Additionally, 85% monitor their databases and other data systems as part of their data governance programs.
Starting in April 2022, Cloudera joined 20 other organizations to help close the gender gap in the tech sector as a member of the Reboot Representation Tech Coalition. In 2018, the Rebooting Representation report exposed the diminutive investments supporting Black, Latina, and Native American women and girls interested in tech.
Observability is a methodology for providing visibility of every journey that data takes from source to customer value across every tool, environment, data store, team, and customer so that problems are detected and addressed immediately. to monitor your data operations. This solution sits on top of your existing infrastructure?without
However, in the typical enterprise, only a small team has the core skills needed to gain access and create value from streams of data. This data engineering skillset typically consists of Java or Scala programming skills mated with deep DevOps acumen. A rare breed. The difficulty with querying streams.
It’s been one year since we’ve started publishing the Alation State of DataCulturereport, and uncertainty still remains the only sure thing. Yet, through it all, organizations that rely on, and invest in, building a dataculture have consistently outperformed those who don’t. Ignore Data at Your Peril.
This is particularly relevant in tax-related fields, like reporting (provision) and transfer pricing. Tax needs to consider innovative ways to collect and process financial data, moving away from manual manipulation and reconciliation to more forward-thinking analytics for real-time decision-making.”.
The global pandemic has driven home the fact that data is vital to the success of every organization. Sisense recently surveyed over 460 companies across Australia and New Zealand to dig into their data and analytics usage and future plans. Who is leading the way?
This guest blog was written by Shanice Omare, Research Manager, Vanson Bourne. Some organizations have taken this as an opportunity for positive change by moving workloads to the cloud and utilizing enterprise data strategies that are key to their business resiliency. The Enterprise Data Maturity Model – Putting resiliency to the test.
The word “data” is ubiquitous in narratives of the modern world. And data, the thing itself, is vital to the functioning of that world. This blog discusses quantifications, types, and implications of data. Quantifications of data. Quantifications of data. So data is big and growing.
. “The scale of most enterprise hybrid cloud deployments is so vast and penetrates so deeply that the need for an all-in security culture is absolute,” says Shue-Jane Thompson, managing partner at IBM Consulting. Per data from a 2022 Verizon report , as many as 8 in 10 security breaches are caused by human error.
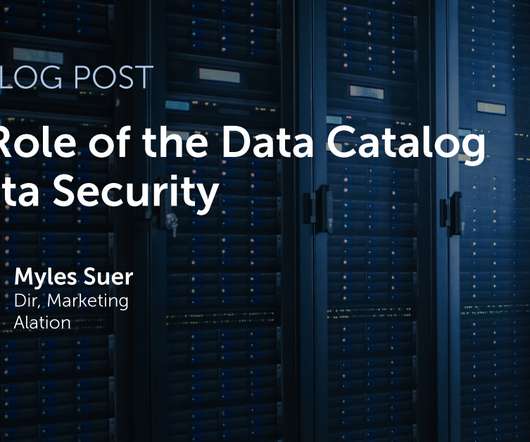
The Role of Catalog in Data Security. Recently, I dug in with CIOs on the topic of data security. What came as no surprise was the importance CIOs place on taking a broader approach to data protection. What did come as a surprise was the central role of the data catalog for CIOs in data protection. What do we know?
While reports vary on whether the Great Resignation is still happening, the memory remains. CPOs are often in charge of organizational culture, ensuring the organization uncovers and resolves unconscious bias in decision-making processes and other components arising during the entire employee lifecycle.
A recent IBM study found that global executives cite inadequate data (41%) as the biggest obstacle to their ESG progress, followed by regulatory barriers (39%), inconsistent standards (37%) and inadequate skills (36%). Enabled report accumulating almost 70% of their carbon capture and energy use metrics in their ERP.
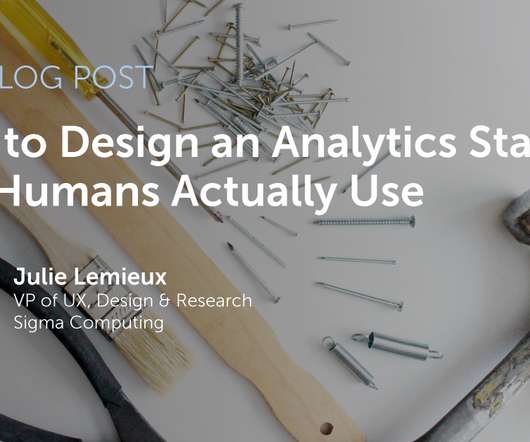
In her current role as VP of UX, Design & Research at Sigma Computing, she deploys human-centric design to support data democratization and analysis. Less than 40 percent of Fortune 1000 companies are managing data as an asset and only 24 percent of executives consider their organization to be data-driven.
Navigating the Storm: How Data Engineering Teams Can Overcome a Data Quality Crisis Ah, the data quality crisis. It’s that moment when your carefully crafted data pipelines start spewing out numbers that make as much sense as a cat trying to bark. But fear not, fellow data wranglers!
Culture shock. How do you bridge the gap between the two? What’s that got to do with data mapping? Enterprise data crosses borders like nobody’s business. From source system to ETL to database to analysis to reporting – the journey is long, the border crossings are many, and standards may change at each crossing.
Imagining the Impact of Citizen Data Scientists ! This process ‘converges data science, analytic and process automation into a single platform—which helps companies automate and integrate the way data and business processes come together. Companies can also make data more actionable across the organization.’. ‘By
Among the passed regulations were updated requirements for Form 8-K reporting as well as new guidance for Form 10-K Amendments. Under the rule surrounding Form 8-K reporting, public companies are now required to reportdata breaches within four days of an incident. million, representing a 15.3% increase from 2020.
In the context of AI, it can refer to the safety and ethics guardrails of AI tools and systems, policies concerning data access and model usage or the government-mandated regulation itself. To cite just one knowledge gap: several senior technology leaders we’ve spoken to have no comprehension of how data can be biased.
erwin by Quest just released the “ 2021 State of Data Governance and Empowerment” report. Today, data needs to fuel rapid decisions that make an organization more effective, customer-centric and competitive. Additionally, 85% monitor their databases and other data systems as part of their data governance programs.
We continue to discover why organizations with a top-tier dataculture lead their competitors. In a statement that captures this point, Gartner predicts that by next year, “organizations that promote data sharing will outperform their peers on most business value metrics.” Tip #1: A Good Data Strategy Starts With People.
According to reports, the gender pay gap is estimated to be 23% globally, which translates to a US$6 trillion loss of income. . There will simply never be enough talent to close the gender gap. . It requires a collective effort, embedded in the culture of an organisation. Anthony, Sarah J. Practise allyship.
By Sebastian Kaus, Data Governance Lead, Vattenfall. Sebastian Kaus is an engineer and Data Governance Lead at Vattenfall, a leading European energy company. He helps people work more efficiently by bridging the gap between conventional engineering disciplines and innovative data-driven approaches. 5-minute read.
As companies digitally transform and become data-driven, each department and team needs to find its own ways to embrace data and insights to make smarter decisions. HR professionals are awash in hiring and employee data of all kinds. Again: Today, HR teams are inundated with HR data from a variety of sources.
Artificial intelligence and machine learning are the future of every industry, especially data and analytics. In its 2020 report “Top 10 Trends in Data and Analytics,” Gartner predicts that only 10% of companies will be using augmented analytics to their full potential. Data volumes and variety are growing exponentially.
Integrated Business Planning (IBP) addresses these challenges by providing a comprehensive framework that integrates strategic, operational and financial planning, analysis, and reporting to drive better business outcomes. Data integration and analytics IBP relies on the integration of data from different sources and systems.
Processes such as job description creation, auto-grading video interviews and intelligent search that once required a human employee can now be completed using data-driven insights and generative AI. As such, HR leaders cannot simply rely on data and AI to make decisions. HR leaders set the tone.
The last blog post from our guest authors at smartPM.solutions was about S&OP maturity and the classification of your current S&OP situation according to the 5-stage Gartner S&OP Maturity Model. If you have not yet determined your S&OP maturity stage, you can do so in our last blog post.
When HR professionals are forced to allocate their time on these routine questions and repetitive tasks, they can’t focus on valuable work such as recruitment, retention and motivation, leadership development, and corporate culture. As HR departments move to a more strategic role, addressing these issues has become a necessity.
While AGI remains theoretical, organizations can take proactive steps to prepare for its arrival by building a robust data infrastructure and fostering a collaborative environment where humans and AI work together seamlessly. This gap highlights the vast difference between current AI and the potential of AGI.
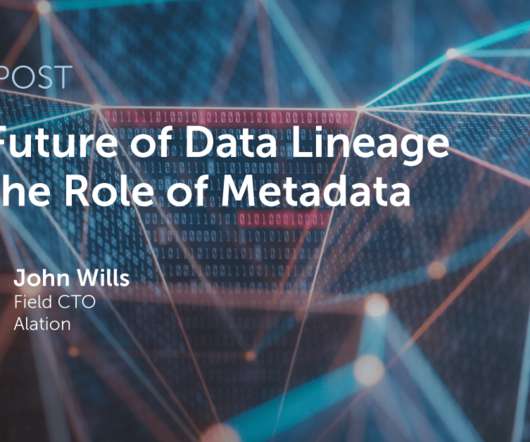
How do you approach data lineage? We all know that data lineage is a complex and challenging topic. In this blog, I am drilling into something I’ve been thinking about and studying for a long time: fundamental approaches to lineage creation and maintenance. What Is Data Lineage Creation & Maintenance?
Predictive analytics Before a new job listing is even written or an open position has been identified, AI algorithms can help analyze various data sources like historical hiring trends, employee turnover rates, business growth projections and workforce demographics.
With the introduction of Artificial Intelligence and Machine Learning, as well as data visualization tools, designed for charting, dashboards and performance scorecards. The emergence of Big Data and Bring Your Own Device (BYOD) has become popular as users share, communicate and collaborate using cloud-based platforms and networks.
Without a doubt, there is exponential growth in the access to and volume of process data we all, as individuals, have at our fingertips. Not only can data support a more compelling change management strategy, but it’s also able to identify, accelerate and embed change faster, all of which is critical in our continuously changing world.
We organize all of the trending information in your field so you don't have to. Join 42,000+ users and stay up to date on the latest articles your peers are reading.
You know about us, now we want to get to know you!
Let's personalize your content
Let's get even more personalized
We recognize your account from another site in our network, please click 'Send Email' below to continue with verifying your account and setting a password.


Let's personalize your content