This site uses cookies to improve your experience. To help us insure we adhere to various privacy regulations, please select your country/region of residence. If you do not select a country, we will assume you are from the United States. Select your Cookie Settings or view our Privacy Policy and Terms of Use.
Cookie Settings
Cookies and similar technologies are used on this website for proper function of the website, for tracking performance analytics and for marketing purposes. We and some of our third-party providers may use cookie data for various purposes. Please review the cookie settings below and choose your preference.
Used for the proper function of the website
Used for monitoring website traffic and interactions
Cookie Settings
Cookies and similar technologies are used on this website for proper function of the website, for tracking performance analytics and for marketing purposes. We and some of our third-party providers may use cookie data for various purposes. Please review the cookie settings below and choose your preference.
Strictly Necessary: Used for the proper function of the website
Performance/Analytics: Used for monitoring website traffic and interactions
The term ‘big data’ alone has become something of a buzzword in recent times – and for good reason. By implementing the right reporting tools and understanding how to analyze as well as to measure your data accurately, you will be able to make the kind of datadriven decisions that will drive your business forward.
The Race For Data Quality In A Medallion Architecture The Medallion architecture pattern is gaining traction among data teams. It is a layered approach to managing and transforming data. By systematically moving data through these layers, the Medallion architecture enhances the data structure in a data lakehouse environment.
A Drug Launch Case Study in the Amazing Efficiency of a Data Team Using DataOps How a Small Team Powered the Multi-Billion Dollar Acquisition of a Pharma Startup When launching a groundbreaking pharmaceutical product, the stakes and the rewards couldnt be higher. data engineers delivered over 100 lines of code and 1.5
That said, to improve the overall efficiency, productivity, performance, and intelligence of your contact center you will need to leverage the wealth of digital data available at your fingertips. Your Chance: Want to test a call center dashboard software for free?
Noting that companies pursued bold experiments in 2024 driven by generative AI and other emerging technologies, the research and advisory firm predicts a pivot to realizing value. Forrester predicts a reset is looming despite the enthusiasm for AI-driven transformations.
Big data has led to some remarkable changes in the field of marketing. Many marketers have used AI and data analytics to make more informed insights into a variety of campaigns. Data analytics tools have been especially useful with PPC marketing , media buying and other forms of paid traffic. Get the most out of your content.
1) What Is Data Quality Management? 4) Data Quality Best Practices. 5) How Do You Measure Data Quality? 6) Data Quality Metrics Examples. 7) Data Quality Control: Use Case. 8) The Consequences Of Bad Data Quality. 9) 3 Sources Of Low-Quality Data. 10) Data Quality Solutions: Key Attributes.
Read the complete blog below for a more detailed description of the vendors and their capabilities. This is not surprising given that DataOps enables enterprise data teams to generate significant business value from their data. Testing and Data Observability. Download the 2021 DataOps Vendor Landscape here.
A survey from the Data & AI Leadership Exchange, an organization focused on AI and data education efforts, found that 98% of senior data leaders at Fortune 1000 companies expect to increase their AI spending in 2025, up from 82% in 2024. Over 90% of those surveyed said investments in AI and data were top priorities.
Big data is at the heart of all successful, modern marketing strategies. Companies that engage in email marketing have discovered that big data is particularly effective. When you are running a data-driven company, you should seriously consider investing in email marketing campaigns. Cost-effective method.
You can see how big data and AI are being utilized by the most astute CBD marketers. You can get a better sense of the role that big data plays in the changing direction of the market. So how can you stand out in a crowded marketplace by leveraging data analytics ? Big Data is Driving Major Changes in the CBD Industry.
Amazon DataZone is a data management service that makes it faster and easier for customers to catalog, discover, share, and govern data stored across AWS, on premises, and from third-party sources. Using Amazon DataZone lets us avoid building and maintaining an in-house platform, allowing our developers to focus on tailored solutions.
While customers can perform some basic analysis within their operational or transactional databases, many still need to build custom data pipelines that use batch or streaming jobs to extract, transform, and load (ETL) data into their data warehouse for more comprehensive analysis. or a later version) database.
Big data technology is leading to a lot of changes in the field of marketing. A growing number of marketers are exploring the benefits of big data as they strive to improve their branding and outreach strategies. Email marketing is one of the disciplines that has been heavily touched by big data. Test Different Calls-to-Action.
We also want to thank all of the data industry groups that have recognized our DataKitchen DataOps Platform and Transformation Advisory Services throughout the year. Full disclosure: some images have been edited to remove ads or to shorten the scrolling in this blog post. DBTA’s 100 Companies That Matter Most in Data.
Is Your Team in Denial of Data Quality? Here’s How to Tell In many organizations, data quality problems fester in the shadowsignored, rationalized, or swept aside with confident-sounding statements that mask a deeper dysfunction. That doesn’t mean the data inside was correct. A pipeline ran “all green”?
Third, any commitment to a disruptive technology (including data-intensive and AI implementations) must start with a business strategy. These changes may include requirements drift, data drift, model drift, or concept drift. I suggest that the simplest business strategy starts with answering three basic questions: What?
More small businesses are leveraging big data technology these days. One of the many reasons that they use big data is to improve their SEO. Data-driven SEO is going to be even more important as the economy continues to stagnate. Data-driven SEO will be one of the most important ways that they can achieve these goals.
Your Chance: Want to test an agile business intelligence solution? It’s necessary to say that these processes are recurrent and require continuous evolution of reports, online data visualization , dashboards, and new functionalities to adapt current processes and develop new ones. Discover the available data sources.
A CRM dashboard is a centralized hub of information that presents customer relationship management data in a way that is dynamic, interactive, and offers access to a wealth of insights that can improve your consumer-facing strategies and communications. Let’s look at this in more detail. What Is A CRM Report? Follow-Up Contact Rate.
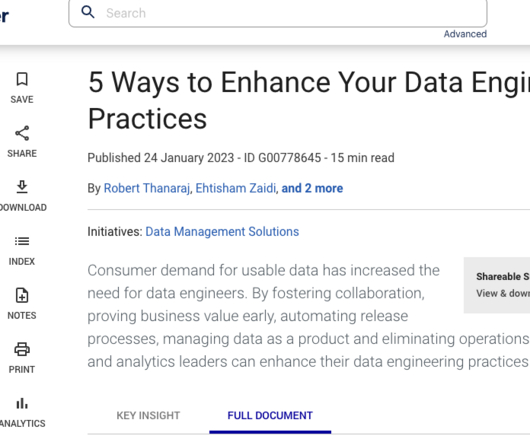
On 24 January 2023, Gartner released the article “ 5 Ways to Enhance Your Data Engineering Practices.” Data team morale is consistent with DataKitchen’s own research. We surveyed 600 data engineers , including 100 managers, to understand how they are faring and feeling about the work that they are doing.
Management reporting is a source of business intelligence that helps business leaders make more accurate, data-driven decisions. They collect data from various departments of the company tracking key performance indicators ( KPIs ) and present them in an understandable way. They were using historical data only.
Amazon Redshift , launched in 2013, has undergone significant evolution since its inception, allowing customers to expand the horizons of data warehousing and SQL analytics. Industry-leading price-performance Amazon Redshift offers up to three times better price-performance than alternative cloud data warehouses.
Organizations run millions of Apache Spark applications each month on AWS, moving, processing, and preparing data for analytics and machine learning. Data practitioners need to upgrade to the latest Spark releases to benefit from performance improvements, new features, bug fixes, and security enhancements. Python 3.7) to Spark 3.3.0
In a world focused on buzzword-driven models and algorithms, you’d be forgiven for forgetting about the unreasonable importance of data preparation and quality: your models are only as good as the data you feed them. Why is high-quality and accessible data foundational?
Data organizations don’t always have the budget or schedule required for DataOps when conceived as a top-to-bottom, enterprise-wide transformational change. DataOps can and should be implemented in small steps that complement and build upon existing workflows and data pipelines. Figure 1: The four phases of Lean DataOps. production).
Data exploded and became big. Spreadsheets finally took a backseat to actionable and insightful data visualizations and interactive business dashboards. The rise of self-service analytics democratized the data product chain. 1) Data Quality Management (DQM). We all gained access to the cloud.
DataOps adoption continues to expand as a perfect storm of social, economic, and technological factors drive enterprises to invest in process-driven innovation. Many in the data industry recognize the serious impact of AI bias and seek to take active steps to mitigate it. Data Gets Meshier. Companies Commit to Remote.
DataOps has become an essential methodology in pharmaceutical enterprise data organizations, especially for commercial operations. Companies that implement it well derive significant competitive advantage from their superior ability to manage and create value from data.
According to recent survey data from Cloudera, 88% of companies are already utilizing AI for the tasks of enhancing efficiency in IT processes, improving customer support with chatbots, and leveraging analytics for better decision-making.
Previously, we discussed the top 19 big data books you need to read, followed by our rundown of the world’s top business intelligence books as well as our list of the best SQL books for beginners and intermediates. Data visualization, or ‘data viz’ as it’s commonly known, is the graphic presentation of data.
Analytics are prone to frequent data errors and deployment of analytics is slow and laborious. When internal resources fall short, companies outsource data engineering and analytics. There’s no shortage of consultants who will promise to manage the end-to-end lifecycle of data from integration to transformation to visualization. .
Amazon DataZone now launched authentication supports through the Amazon Athena JDBC driver, allowing data users to seamlessly query their subscribed data lake assets via popular business intelligence (BI) and analytics tools like Tableau, Power BI, Excel, SQL Workbench, DBeaver, and more.
The data mesh design pattern breaks giant, monolithic enterprise data architectures into subsystems or domains, each managed by a dedicated team. DataOps helps the data mesh deliver greater business agility by enabling decentralized domains to work in concert. . But first, let’s define the data mesh design pattern.
In early April 2021, DataKItchen sat down with Jonathan Hodges, VP Data Management & Analytics, at Workiva ; Chuck Smith, VP of R&D Data Strategy at GlaxoSmithKline (GSK) ; and Chris Bergh, CEO and Head Chef at DataKitchen, to find out about their enterprise DataOps transformation journey, including key successes and lessons learned.
Today, there are online data visualization tools that make it easy and fast to build powerful market-centric research dashboards. Your Chance: Want to test a market research reporting software? Let’s get started. Explore our 14 day free trial & benefit from market research reports! What Is A Market Research Report?
AI users say that AI programming (66%) and data analysis (59%) are the most needed skills. Unexpected outcomes, security, safety, fairness and bias, and privacy are the biggest risks for which adopters are testing. Few nonusers (2%) report that lack of data or data quality is an issue, and only 1.3%
In our cutthroat digital age, the importance of setting the right data analysis questions can define the overall success of a business. That being said, it seems like we’re in the midst of a data analysis crisis. Your Chance: Want to perform advanced data analysis with a few clicks? Data Is Only As Good As The Questions You Ask.
Table of Contents 1) Benefits Of Big Data In Logistics 2) 10 Big Data In Logistics Use Cases Big data is revolutionizing many fields of business, and logistics analytics is no exception. The complex and ever-evolving nature of logistics makes it an essential use case for big data applications. Did you know?
Feature Development and Data Management: This phase focuses on the inputs to a machine learning product; defining the features in the data that are relevant, and building the data pipelines that fuel the machine learning engine powering the product. is that there is often a problem with data volume.
4) How to Select Your KPIs 5) Avoid These KPI Mistakes 6) How To Choose A KPI Management Solution 7) KPI Management Examples Fact: 100% of statistics strategically placed at the top of blog posts are a direct result of people studying the dynamics of Key Performance Indicators, or KPIs. What Are KPI Best Practices?
The need to integrate diverse data sources has grown exponentially, but there are several common challenges when integrating and analyzing data from multiple sources, services, and applications. First, you need to create and maintain independent connections to the same data source for different services.
We’ll also discuss building DataOps expertise around the data organization, in a decentralized fashion, using DataOps centers of excellence (COE) or DataOps Dojos. Develop/execute regression testing . Testdata management and other functions provided ‘as a service’ . DataOps Technical Services. Deploy to production.
The rise of innovative, interactive, data-driven dashboard tools has made creating effective dashboards – like the one featured above – swift, simple, and accessible to today’s forward-thinking businesses. Dashboard design should be the cherry on top of your business intelligence (BI) project. Now, it’s time for the fun part.
We organize all of the trending information in your field so you don't have to. Join 42,000+ users and stay up to date on the latest articles your peers are reading.
You know about us, now we want to get to know you!
Let's personalize your content
Let's get even more personalized
We recognize your account from another site in our network, please click 'Send Email' below to continue with verifying your account and setting a password.


Let's personalize your content