This site uses cookies to improve your experience. To help us insure we adhere to various privacy regulations, please select your country/region of residence. If you do not select a country, we will assume you are from the United States. Select your Cookie Settings or view our Privacy Policy and Terms of Use.
Cookie Settings
Cookies and similar technologies are used on this website for proper function of the website, for tracking performance analytics and for marketing purposes. We and some of our third-party providers may use cookie data for various purposes. Please review the cookie settings below and choose your preference.
Used for the proper function of the website
Used for monitoring website traffic and interactions
Cookie Settings
Cookies and similar technologies are used on this website for proper function of the website, for tracking performance analytics and for marketing purposes. We and some of our third-party providers may use cookie data for various purposes. Please review the cookie settings below and choose your preference.
Strictly Necessary: Used for the proper function of the website
Performance/Analytics: Used for monitoring website traffic and interactions
What Is A Data Analysis Method? Data analysis method focuses on strategic approaches to taking raw data, mining for insights that are relevant to the business’s primary goals, and drilling down into this information to transform metrics, facts, and figures into initiatives that benefit improvement. Harvest your data.
If you want to survive, it’s time to act.” – Capgemini and EMC² in their study Big & Fast Data: The Rise of Insight-Driven Business. You’ll want to be mindful of the level of measurement for your different variables, as this will affect the statistical techniques you will be able to apply in your analysis.
There is not a clear line between business intelligence and analytics, but they are extremely connected and interlaced in their approach towards resolving business issues, providing insights on past and present data, and defining future decisions. But let’s see in more detail what experts say and how can we connect and differentiate the both.
According to the US Bureau of Labor Statistics, demand for qualified business intelligence analysts and managers is expected to soar to 14% by 2026, with the overall need for data professionals to climb to 28% by the same year. This beats projections for almost all other occupations. BI engineer.
The demand for real-time online data analysis tools is increasing and the arrival of the IoT (Internet of Things) is also bringing an uncountable amount of data, which will promote the statistical analysis and management at the top of the priorities list. It’s an extension of datamining which refers only to past data.
This interdisciplinary field of scientific methods, processes, and systems helps people extract knowledge or insights from data in a host of forms, either structured or unstructured, similar to datamining.
Predictive analytics encompasses techniques like datamining, machine learning (ML) and predictive modeling techniques like time series forecasting, classification, association, correlation, clustering, hypothesis testing and descriptive statistics to analyze current and historical data and predict future events, results and business direction.
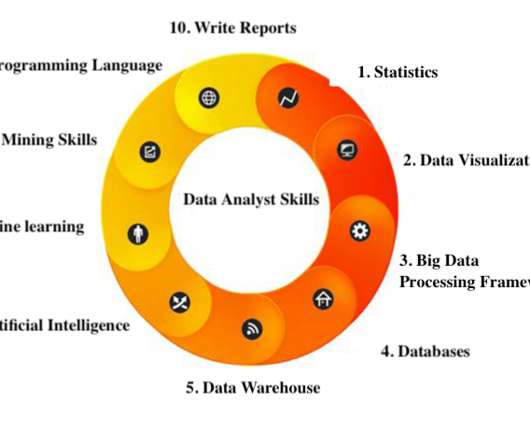
Framework Big Data Processing: Hadoop, storm, spark. Data Warehous: SSIS, SSAS. Skill DataMining: Matlab, R, Python. Seperti yang Anda ketahui, statistik adalah dasar analisis data. Statistik juga adalah sebuah skill utama seorang data analyst. Anda perlu memahami prinsip dibalik data.
One of the best beginners’ books on SQL for the analytical mindset, this masterful creation demonstrates how to leverage the two most vital tools for data query and analysis – SQL and Excel – to perform comprehensive data analysis without the need for a sophisticated and expensive datamining tool or application.
Search engines use datamining tools to find links from other sites. They use a sophisticated data-driven algorithm to assess the quality of these sites based on the volume and quantity of inbound links. Oftentimes, this means citing a statistic or providing content for further reading. Offering value to readers.
Data cleansing, metadata management, data distribution, storage management, recovery, and backup planning are processes conducted in a data warehouse while BI makes use of tools that focus on statistics, visualization, and datamining. But let’s see this through our next major aspect.
But more specifically, it represents the toolkits that leaders employ when they want to collect and manage data assets produce informative reports to optimize the current workflows. Business analytics is how companies use statistical methods and techniques to analyze historical data to gain new insights and improve strategic decision-making.
Historic Balance – compares current data to previous or expected values. These tests rely upon historical values as a reference to determine whether data values are reasonable (or within the range of reasonable). . Statistical Process Control – applies statistical methods to control a process.
Social Media, Blogging & Reviews are the new age connectors among the Millennials, where they post their experiences. Text analytics helps to draw the insights from the unstructured data. . Text mining is also referred to as text analytics, is the process of deriving high -quality information from text.
Though you may encounter the terms “data science” and “data analytics” being used interchangeably in conversations or online, they refer to two distinctly different concepts. Meanwhile, data analytics is the act of examining datasets to extract value and find answers to specific questions.
Traditionally, demand forecasting involved sales managers coming together at the end of every three months to analyze the sales statistics of the bygone business quarter. They realised that to reduce their margin gap, it was important for them to be agile and adopt a more data-driven approach that can deliver results in real time.
Tech Target editor Craig Stedman, declared self-service business intelligence “an approach to data analytics that enables business users to access and explore data sets even if they don’t have a background in BI or related functions like datamining and statistical analysis.”. Subscribe to Alation's Blog.
By clubbing various techniques like datamining, machine learning, artificial intelligence and statistical modelling, it makes predictions about events in the future. Predictive Analytics, a form of advanced analytics is also making great breakthroughs in the solving the debt collection problem.
In Talking Data , we delve into the rapidly evolving worlds of Natural Language Processing and Generation. Text data is proliferating at a staggering rate, and only advanced coding languages like Python and R will be able to pull insights out of these datasets at scale. R: Analytics powerhouse.
The sheer quantity and scope of data produced and stored by your company can make it incredibly hard to peer through the number-fog to pick out the details you need. This is where Business Analytics (BA) and Business Intelligence (BI) come in: both provide methods and tools for handling and making sense of the data at your disposal.
For example, imagine a fantasy football site is considering displaying advanced player statistics. A ramp-up strategy may mitigate the risk of upsetting the site’s loyal users who perhaps have strong preferences for the current statistics that are shown. One reason to do ramp-up is to mitigate the risk of never before seen arms.
It uses advanced tools to look at raw data, gather a data set, process it, and develop insights to create meaning. Areas making up the data science field include mining, statistics, data analytics, data modeling, machine learning modeling and programming. appeared first on IBM Blog.
But more specifically, it represents the toolkits that leaders employ when they want to collect and manage data assets produce informative reports to optimize the current workflows. Business analytics is how companies use statistical methods and techniques to analyze historical data to gain new insights and improve strategic decision-making.
Social Media, Blogging & Reviews are the new age connectors among the Millennials, where they post their experiences. Text analytics helps to draw the insights from the unstructured data. Text mining is also referred to as text analytics, is the process of deriving high -quality information from text.
We’ve been talking a lot recently about companies needing to use their data in order to stay in business in the future. We’ve even gone as far as saying that every company is a data company , whether they know it or not. Every company has been generating data for a while now. But what is a BI strategy in today’s world?
Part one of our blog series explored how people are the driving force behind the digital transformation and how it is fueled by artificial intelligence and machine learning. It quickly processes large amounts of data from internal and external sources, so users can recognize patterns and gain deeper insights to make better decisions.
Over the coming weeks, we will outline all six strategies in detail through this blog series. Can’t wait for the next blog? The post Introduction to Six Strategies for Advancing Customer Knowledge appeared first on Cloudera Blog. Access the full report here.
If $Y$ at that point is (statistically and practically) significantly better than our current operating point, and that point is deemed acceptable, we update the system parameters to this better value. This blog post discusses such a comprehensive approach that is used at Youtube. Journal of Statistical Software, 56(1):1-56, 2014. [5]
By contrast, traditional BI platforms are designed to support modular development of IT-produced analytic content, specialized tools and skills, and significant upfront data modeling, coupled with a predefined metadata layer, is required to access their analytic capabilities. Research VP, Business Analytics and Data Science.
Machine learning (ML), a subset of artificial intelligence (AI), is an important piece of data-driven innovation. Machine learning engineers take massive datasets and use statistical methods to create algorithms that are trained to find patterns and uncover key insights in datamining projects.
Here you'll find all my blog posts categorized into a structure that will hopefully make it easy for you to discover new content, find answers to your questions, or simply wallow in some excellent analytics narratives. Blogging Experience Articles. + Convert Data Skeptics: Document, Educate & Pick Your Poison.
He went on to be the head brewer of Guinness and we thank him for not just great hand-crafted beers but subsequent research breakthroughs in statistical research as well. Data allowed Guinness to hold their market dominance for long. Datamining. Visual Analytics and Data Visualization. That was in the 1900’s.
Unlike experimentation in some other areas, LSOS experiments present a surprising challenge to statisticians — even though we operate in the realm of “big data”, the statistical uncertainty in our experiments can be substantial. We must therefore maintain statistical rigor in quantifying experimental uncertainty.
1) What Is A Misleading Statistic? 2) Are Statistics Reliable? 3) Misleading Statistics Examples In Real Life. 4) How Can Statistics Be Misleading. 5) How To Avoid & Identify The Misuse Of Statistics? If all this is true, what is the problem with statistics? What Is A Misleading Statistic?
In this post we explore why some standard statistical techniques to reduce variance are often ineffective in this “data-rich, information-poor” realm. Despite a very large number of experimental units, the experiments conducted by LSOS cannot presume statistical significance of all effects they deem practically significant.
An excerpt from a rave review : “I would definitely recommend this book to everyone interested in learning about data from scratch and would say it is the finest resource available among all other Big Data Analytics books.”. If we had to pick one book for an absolute newbie to the field of Data Science to read, it would be this one.
If you are still unconvinced or uncertain about the critical importance of business intelligence (BI) and analytics for businesses like yours, here are some sobering, surprising and impressive statistics to ponder. Organizations leave 97% of gathered data unused. 74% of employees feel unhappy or overwhelmed when working with data.
We organize all of the trending information in your field so you don't have to. Join 42,000+ users and stay up to date on the latest articles your peers are reading.
You know about us, now we want to get to know you!
Let's personalize your content
Let's get even more personalized
We recognize your account from another site in our network, please click 'Send Email' below to continue with verifying your account and setting a password.


Let's personalize your content