This site uses cookies to improve your experience. To help us insure we adhere to various privacy regulations, please select your country/region of residence. If you do not select a country, we will assume you are from the United States. Select your Cookie Settings or view our Privacy Policy and Terms of Use.
Cookie Settings
Cookies and similar technologies are used on this website for proper function of the website, for tracking performance analytics and for marketing purposes. We and some of our third-party providers may use cookie data for various purposes. Please review the cookie settings below and choose your preference.
Used for the proper function of the website
Used for monitoring website traffic and interactions
Cookie Settings
Cookies and similar technologies are used on this website for proper function of the website, for tracking performance analytics and for marketing purposes. We and some of our third-party providers may use cookie data for various purposes. Please review the cookie settings below and choose your preference.
Strictly Necessary: Used for the proper function of the website
Performance/Analytics: Used for monitoring website traffic and interactions
Over the past decade, business intelligence has been revolutionized. Data exploded and became big. Spreadsheets finally took a backseat to actionable and insightful data visualizations and interactive business dashboards. The rise of self-service analytics democratized the data product chain.
In a world focused on buzzword-driven models and algorithms, you’d be forgiven for forgetting about the unreasonable importance of data preparation and quality: your models are only as good as the data you feed them. Why is high-quality and accessible data foundational? Re-analyzing existing data is often very bad.”
In June 2021, we asked the recipients of our Data & AI Newsletter to respond to a survey about compensation. The average salary for data and AI professionals who responded to the survey was $146,000. We didn’t use the data from these respondents; in practice, discarding this data had no effect on the results.
Datascience has become an extremely rewarding career choice for people interested in extracting, manipulating, and generating insights out of large volumes of data. To fully leverage the power of datascience, scientists often need to obtain skills in databases, statistical programming tools, and data visualizations.
The term ‘big data’ alone has become something of a buzzword in recent times – and for good reason. By implementing the right reporting tools and understanding how to analyze as well as to measure your data accurately, you will be able to make the kind of data driven decisions that will drive your business forward.
The objective here is to brainstorm on potential security vulnerabilities and defenses in the context of popular, traditional predictive modeling systems, such as linear and tree-based models trained on static data sets. Data poisoning attacks. Data poisoning attacks have also been called “causative” attacks.)
ChatGPT supports conversations; it remembers what you have said, so you don’t have to paste in the entire history with each prompt, as you did with GPT-3. Unlike labels, embeddings are learned from the training data, not produced by humans. The design of Transformers lends itself to large sets of training data.
The future of datascience jobs continues to be brighter than ever in 2020. According to Glassdoor’s list of Best Jobs in America for the past four years, “data scientist” topped in terms of job demand, job satisfaction, and pay with an average base salary of more than $100,000 per year. Level of Education.
1) What Is Data Interpretation? 2) How To Interpret Data? 3) Why Data Interpretation Is Important? 4) Data Analysis & Interpretation Problems. 5) Data Interpretation Techniques & Methods. 6) The Use of Dashboards For Data Interpretation. Business dashboards are the digital age tools for big data.
AI users say that AI programming (66%) and data analysis (59%) are the most needed skills. Its adopters expect returns, and if not, well, AI has experienced many “winters” in the past. We don’t expect that situation to change much in the near future. Many AI adopters are still in the early stages. of nonusers and 13% of users.
Python is used extensively among Data Engineers and Data Scientists to solve all sorts of problems from ETL/ELT pipelines to building machine learning models. Apache HBase is an effective data storage system for many workflows but accessing this data specifically through Python can be a struggle.
“You can have data without information, but you cannot have information without data.” – Daniel Keys Moran. When you think of big data, you usually think of applications related to banking, healthcare analytics , or manufacturing. However, the usage of data analytics isn’t limited to only these fields. Discover 10.
Personalized Interactions: With AI prompts, chatbots can tailor their responses based on user behavior, preferences, and past interactions, making conversations feel more personalized and engaging. Data Privacy Concerns: With chatbots collecting vast amounts of user data, concerns about data privacy and security are ever-present.
Big data technology has been one of the biggest forces driving change in the financial sector over the past few years. Financial institutions servicing small businesses have been among those most affected by developments in big data. Big Data is the Future of Small Business Lending. We are in the age of data.
It looks a little further out into the future than I normally tend to. Artificial Intelligence | Future | Kids. On that topic… My first true moment of worry about my professional future came in March 2016 when AlphaGo beat Lee Sedol , the unassailable Go grandmaster. This is not some future fantasy. A rare post today.
Exclusive Bonus Content: Ready to use data analytics in your restaurant? Get our free bite-sized summary for increasing your profits through data! By managing your information with data analysis tools , you stand to sharpen your competitive edge, increase your profitability, boost profit margins, and grow your customer base.
Historically, the terms data report or business report haven’t got the crowds excited. Data reports have always been important for businesses. The business intelligence industry has been revolutionized over the past decade and data reports are in on the fun. Exclusive Bonus Content: Get our data reporting recommendations!
Aptly named, metadata management is the process in which BI and Analytics teams manage metadata, which is the data that describes other data. In other words, data is the context and metadata is the content. Without metadata, BI teams are unable to understand the data’s full story. TDWI – David Loshin.
In 2017, The Economist declared that data, rather than oil, had become the world’s most valuable resource. Organizations across every industry have been and continue to invest heavily in data and analytics. But like oil, data and analytics have their dark side. The refrain has been repeated ever since. 25 and Oct.
This is part 4 in this blog series. This blog series follows the manufacturing and operations data lifecycle stages of an electric car manufacturer – typically experienced in large, data-driven manufacturing companies. The second blog dealt with creating and managing Data Enrichment pipelines.
Because things are changing and becoming more competitive in every sector of business, the benefits of business intelligence and proper use of data analytics are key to outperforming the competition. BI software uses algorithms to extract actionable insights from a company’s data and guide its strategic decisions.
Businesses had to literally switch operations, and enable better collaboration and access to data in an instant — while streamlining processes to accommodate a whole new way of doing things. Given the year we’re experiencing, we’re also looking forward to future entries for next year.
Jason McVay is a data scientist at Indigo Ag, an agriculture-tech company headquartered in Massachusetts. He has an education in environmental science and geography, with a Master’s degree in paleoecology. Spatial data isn’t special but thinking spatially – now that’s a skill everyone should learn. The rise of spatial data.
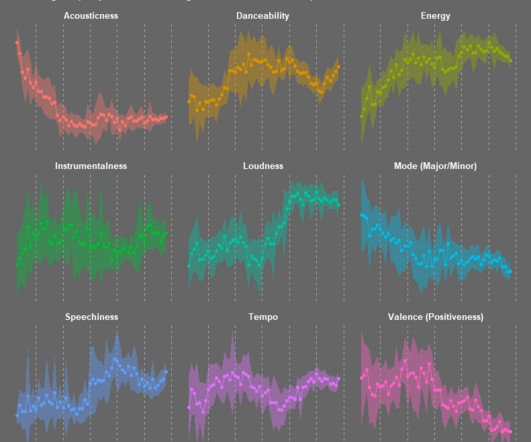
Essentially, this is a visual enhancement to a graph, which offers more detail and context to data changing over time. Area Bands enhance standard Line Graphs by filling the space between upper and lower value lines with a shaded area, providing a visual representation of the range boundaries.
“BI is about providing the right data at the right time to the right people so that they can take the right decisions” – Nic Smith. Data analytics isn’t just for the Big Guys anymore; it’s accessible to ventures, organizations, and businesses of all shapes, sizes, and sectors. And the success stories are seemingly endless.
The industry demand for Data Engineers is constantly on the rise, and with it more and more software engineers and recent graduates try to enter the field. The biggest hurdle for newcomers lies in understanding the Data Engineering landscape and getting hands-on experience with relevant frameworks. Want to Become a Data Engineer?
Vaccine development became the top priority for the life sciences industry – delivering new vaccines at unprecedented speed and maneuvering large-scale production processes. The Impact of Data and Analytics. Now is the time to reflect and learn from the events of the past two years. Maintain Momentum.
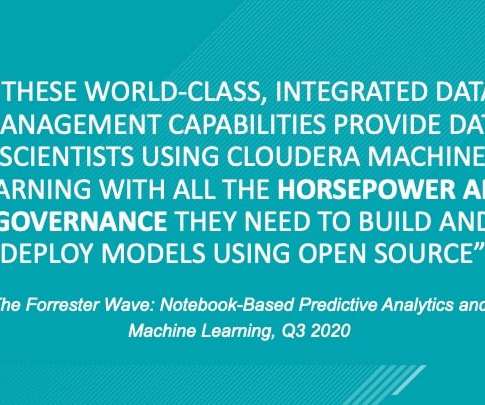
At Cloudera, we are committed to always staying at the forefront of data and analytics innovation — enabling enterprises to more optimally work with data to deliver analytic results across the business quickly and securely. Looking To The Future. Cloudera Is A Machine Learning – Machine”.
by THOMAS OLAVSON Thomas leads a team at Google called "Operations DataScience" that helps Google scale its infrastructure capacity optimally. ln this post he describes where and how having “humans in the loop” in forecasting makes sense, and reflects on past failures and successes that have led him to this perspective.
Visualizing the data and interacting on a single screen is no longer a luxury but a business necessity. A professional dashboard maker enables you to access data on a single screen, easily share results, save time, and increase productivity. That’s why we welcome you to the world of interactive dashboards.
Amazon Redshift is a fully managed, petabyte-scale data warehouse service in the cloud. Tens of thousands of customers use Amazon Redshift to process exabytes of data every day to power their analytics workloads. Forecasting acts as a planning tool to help enterprises prepare for the uncertainty that can occur in the future.
Technology drives the ability to use enterprise data to make choices, decisions and investments – which then produce competitive advantage. Thousands of our customers across all industries are harnessing the power of their data in order to drive insights and innovation. Quality data needs to be the normalizing factor.
We live in a hybrid data world. In the past decade, the amount of structured data created, captured, copied, and consumed globally has grown from less than 1 ZB in 2011 to nearly 14 ZB in 2020. Impressive, but dwarfed by the amount of unstructured data, cloud data, and machine data – another 50 ZB.
AI and machine learning are the future of every industry, especially data and analytics. Reading through the Gartner Top 10 Trends in Data and Analytics for 2020 , I was struck by how different terms mean different things to different audiences under different contexts. Trend 2: Decline of the dashboard.
Mark’s team is constantly adapting to and meeting the challenges of a rapidly evolving business using cloud technologies, real-time analytics, data warehousing, and virtualization. What if we could use this data to focus our resources and deliver better products?
It will take a lot of work to continue building a more equitable world and to forge the way for the next generation of women in tech; hopefully after hearing from these Sisensers, you’ll understand a bit about how far we’ve come and reaffirm your commitment to helping build a better future. Gift them with non-gendered or science-based toys.
That’s why I am proud of our collaboration with Cloudera in making A Fresh Squeeze on Data – A picture book about problem-solving with DATA that encourages children worldwide to transform from passive spectators of technology disruption to active participants of positive change in their local communities and the world. .
This blog post was written by Pedro Pereira as a guest author for Cloudera. . Big data and AI amplify the problem. “If Big data algorithms are smart, but not smart enough to solve inherently human problems. AI and other data-intensive algorithms are infants. If y ou have good intentions, you can make it very good.
It is well known that Artificial Intelligence (AI) has progressed, moving past the era of experimentation. Today, AI presents an enormous opportunity to turn data into insights and actions, to amplify human capabilities, decrease risk and increase ROI by achieving break through innovations. IBM Global AI Adoption Index 2022.).
Cloudera: Your Trusted Partner in AI With over 25 Exabytes of Data Under Management and hundreds of customers leveraging our platform for Machine Learning, Cloudera has a long and successful history as an industry leader. ” said Sanjeev Mohan, Principal, SanjMo & Former Gartner Research VP, Data & Analytics.
In Talking Data , we delve into the rapidly evolving worlds of Natural Language Processing and Generation. Text data is proliferating at a staggering rate, and only advanced coding languages like Python and R will be able to pull insights out of these datasets at scale. NLP can be used on written text or speech data.
One of those areas is called predictive analytics, where companies extract information from existing data to determine buying patterns and forecast future trends. By using a combination of data, statistical algorithms, and machine learning techniques, predictive analytics identifies the likelihood of future outcomes based on the past.
The compact design and touch-based interactivity seemed like a leap into the future. Demystifying generative AI At the heart of Generative AI lie massive databases of texts, images, code and other data types. This data is fed into generational models, and there are a few to choose from, each developed to excel at a specific task.
On June 7, 1983, a product was born that would revolutionize how organizations would store, manage, process , and query their data: IBM Db2. Over the past 40 years, Db2 has been on an exciting and transformational journey. Codd published his famous paper “ A Relational Model of Data for Large Shared Data Banks.”
We organize all of the trending information in your field so you don't have to. Join 42,000+ users and stay up to date on the latest articles your peers are reading.
You know about us, now we want to get to know you!
Let's personalize your content
Let's get even more personalized
We recognize your account from another site in our network, please click 'Send Email' below to continue with verifying your account and setting a password.


Let's personalize your content