This site uses cookies to improve your experience. To help us insure we adhere to various privacy regulations, please select your country/region of residence. If you do not select a country, we will assume you are from the United States. Select your Cookie Settings or view our Privacy Policy and Terms of Use.
Cookie Settings
Cookies and similar technologies are used on this website for proper function of the website, for tracking performance analytics and for marketing purposes. We and some of our third-party providers may use cookie data for various purposes. Please review the cookie settings below and choose your preference.
Used for the proper function of the website
Used for monitoring website traffic and interactions
Cookie Settings
Cookies and similar technologies are used on this website for proper function of the website, for tracking performance analytics and for marketing purposes. We and some of our third-party providers may use cookie data for various purposes. Please review the cookie settings below and choose your preference.
Strictly Necessary: Used for the proper function of the website
Performance/Analytics: Used for monitoring website traffic and interactions
Ali Tore, Senior Vice President of Advanced Analytics at Salesforce, highlighting the value of this integration, says “We’re excited to partner with Amazon to bring Tableau’s powerful data exploration and AI-driven analytics capabilities to customers managing data across organizational boundaries with Amazon DataZone.
Amazon DataZone is a data management service that makes it faster and easier for customers to catalog, discover, share, and govern data stored across AWS, on premises, and from third-party sources. Refer to the detailed blog post on how you can use this to connect through various other tools.
There are countless examples of big datatransforming many different industries. It can be used for something as visual as reducing traffic jams, to personalizing products and services, to improving the experience in multiplayer video games. This is something that you can learn more about in just about any technology blog.
We are excited to announce a new capability of the AWS Glue Studio visual editor that offers a new visual user experience. Now you can author data preparation transformations and edit them with the AWS Glue Studio visual editor. Within the new experience, you can choose from hundreds of prebuilt transformations.
With the ability to browse metadata, you can understand the structure and schema of the data source, identify relevant tables and fields, and discover useful data assets you may not be aware of. You can navigate to the projects Data page to visually verify the existence of the newly created table. option("url", jdbcurl).option("dbtable",
And all of them are asking hard questions: “Can you integrate my data, with my particular format?”, “How well can you scale?”, “How many visualizations do you offer?”. Nowadays, data analytics doesn’t exist on its own. You have to take care of data extraction, transformation and loading, and of visualization.
Financial efficiency: One of the key benefits of big data in supply chain and logistics management is the reduction of unnecessary costs. Using the right dashboard and datavisualizations, it’s possible to hone in on any trends or patterns that uncover inefficiencies within your processes. Now’s the time to strike.
He/she assists the organization by providing clarity and insight into advanced data technology solutions. As quality issues are often highlighted with the use of dashboard software , the change manager plays an important role in the visualization of data quality. Here, it all comes down to the datatransformation error rate.
When we announced the GA of Cloudera Data Engineering back in September of last year, a key vision we had was to simplify the automation of datatransformation pipelines at scale. Typically users need to ingest data, transform it into optimal format with quality checks, and optimize querying of the data by visual analytics tool.
In 2024, datavisualization companies play a pivotal role in transforming complex data into captivating narratives. This blog provides an insightful exploration of the leading entities shaping the datavisualization landscape.
The main driving factors include lower total cost of ownership, scalability, stability, improved ingestion connectors (such as Data Prepper , Fluent Bit, and OpenSearch Ingestion), elimination of external cluster managers like Zookeeper, enhanced reporting, and rich visualizations with OpenSearch Dashboards.
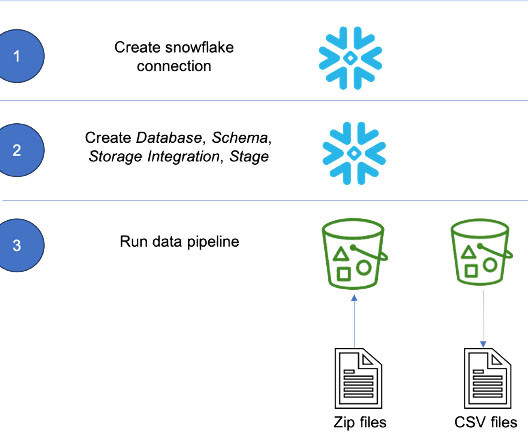
This allows business analysts and decision-makers to gain valuable insights, visualize key metrics, and explore the data in depth, enabling informed decision-making and strategic planning for pricing and promotional strategies. Open the secret blog-glue-snowflake-credentials. Under Secret value , choose Retrieve secret value.
With AWS Glue, you can discover and connect to hundreds of diverse data sources and manage your data in a centralized data catalog. It enables you to visually create, run, and monitor extract, transform, and load (ETL) pipelines to load data into your data lakes. Select Visual ETL in the central pane.
DataOps establishes a process hub that automates data production and analytics development workflows so that the data team is more efficient, innovative and less prone to error. In this blog, we’ll explore the role of the DataOps Engineer in driving the data organization to higher levels of productivity.
AWS Glue , a serverless data integration and extract, transform, and load (ETL) service, has revolutionized this process, making it more accessible and efficient. AWS Glue eliminates complexities and costs, allowing organizations to perform data integration tasks in minutes, boosting efficiency. Customers can now use AWS Glue 4.0
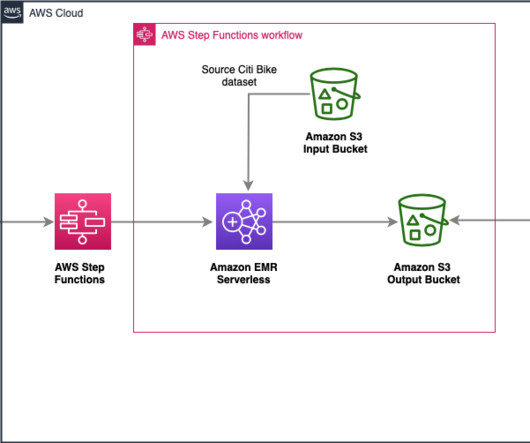
AWS Step Functions is a serverless orchestration service that enables developers to build visual workflows for applications as a series of event-driven steps. EMR Serverless automatically scales resources up and down to provide just the right amount of capacity for your application, and you only pay for what you use.
CDP Data Engineering (1) – a service purpose-built for data engineers focused on deploying and orchestrating datatransformation using Spark at scale. 3) DataVisualization is in Tech Preview on AWS and Azure. The post Happy Birthday, CDP Public Cloud appeared first on Cloudera Blog.
Here are a few examples that we have seen of how this can be done: Batch ETL with Azure Data Factory and Azure Databricks: In this pattern, Azure Data Factory is used to orchestrate and schedule batch ETL processes. Azure Blob Storage serves as the data lake to store raw data. Azure Machine Learning).
This blog post is co-written with James Sun from Snowflake. Customers rely on data from different sources such as mobile applications, clickstream events from websites, historical data, and more to deduce meaningful patterns to optimize their products, services, and processes. Choose Airflow version 2.6.3. Choose Next.
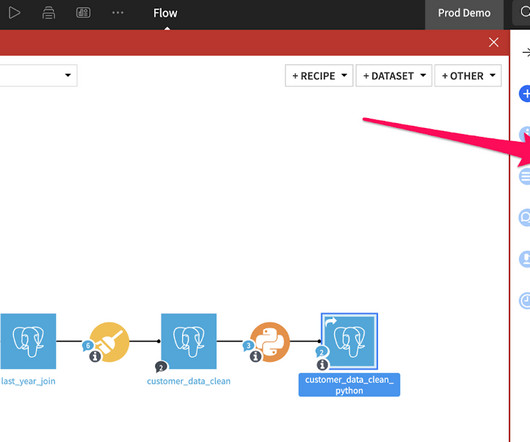
In our last three blogs, we covered how Dataiku’s visual flow can help enhance collaboration and visibility, differences in how you work with datasets , and one of the key tools to accelerate datatransformations: recipes. Welcome back to part four of the Alteryx to Dataiku series!
These tools range from enterprise service bus (ESB) products, data integration tools; extract, transform and load (ETL) tools, procedural code, application program interfaces (API)s, file transfer protocol (FTP) processes, and even business intelligence (BI) reports that further aggregate and transformdata.
It’s because it’s a hard thing to accomplish when there are so many teams, locales, data sources, pipelines, dependencies, datatransformations, models, visualizations, tests, internal customers, and external customers.
Continuing from my previous blog post about how awesome and easy it is to develop web-based applications backed by Cloudera Operational Database (COD), I started a small project to integrate COD with another CDP cloud experience, Cloudera Machine Learning (CML). . b) Basic datatransformation. Go to runner.py and run it.
In addition, more data is becoming available for processing / enrichment of existing and new use cases e.g., recently we have experienced a rapid growth in data collection at the edge and an increase in availability of frameworks for processing that data. As a result, alternative data integration technologies (e.g.,
Developers need to onboard new data sources, chain multiple datatransformation steps together, and explore data as it travels through the flow. A reimagined visual editor to boost developer productivity and enable self service. Enabling self-service for developers.
Amazon AppFlow , a fully managed data integration service, has been at the forefront of streamlining data transfer between AWS services, software as a service (SaaS) applications, and now Google BigQuery. Select a data source: In Amazon AppFlow , select Google BigQuery as your data source.
The general availability covers Iceberg running within some of the key data services in CDP, including Cloudera Data Warehouse ( CDW ), Cloudera Data Engineering ( CDE ), and Cloudera Machine Learning ( CML ). In this first blog, we shared with you how to use Apache Iceberg in Cloudera Data Platform to build an open lakehouse.
This blog post is co-written with Steve Alexander at PG&E. Data collection and processing are handled by a third-party smart sensor manufacturer application residing in Amazon Virtual Private Cloud (Amazon VPC) private subnets behind a Network Load Balancer.
Building a data-driven business includes choosing the right software and implementing best practices around its use. Every year when budget time rolls around, many organizations find themselves asking the same question: “what are we going to do about our data?” This is a summary article. New year, same questions.
We live in a world of data: There’s more of it than ever before, in a ceaselessly expanding array of forms and locations. Dealing with Data is your window into the ways data teams are tackling the challenges of this new world to help their companies and their customers thrive. billion market by 2025.
Also, such a concept helps admin to visualize the jobs which are scheduled for debugging purposes. YuniKorn, thus empowers Apache Spark to become an enterprise-grade essential platform for users, offering a robust platform for a variety of applications ranging from large scale datatransformation to analytics to machine learning.
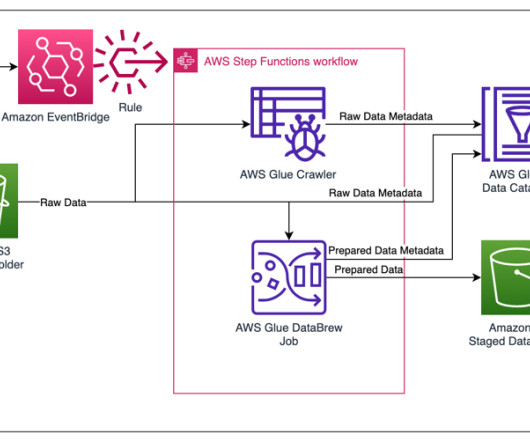
Provision resources with AWS CloudFormation For the initial setup, you launch an AWS CloudFormation stack to create an S3 bucket to store data, IAM roles for data access, and the AWS Glue crawler and Data Catalog components. This will enable both the CDC steps and the datatransformation steps for the Jira data.
For ease of understanding the differences between all of the them Rita shared this visual, categorizing the vendors: So at least for now, it looks like we’re a self-service data prep vendor, which makes sense. Alation helps analysts find, understand and use their data. Subscribe to Alation's Blog. I hope to see you there!
We just announced the general availability of Cloudera DataFlow Designer , bringing self-service data flow development to all CDP Public Cloud customers. In our previous DataFlow Designer blog post , we introduced you to the new user interface and highlighted its key capabilities.
In this blog, I will cover: What is watsonx.ai? Capabilities within the Prompt Lab include: Summarize: Transform text with domain-specific content into personalized overviews and capture key points (e.g., What capabilities are included in watsonx.ai? What is watsonx.data? What capabilities are included in watsonx.data?
Business Intelligence Tools: Business intelligence (BI) tools are used to visualize your data. You should pick those that allow for easy integration and can create beautiful datavisualizations. These help data analysts visualize key insights that can help you make better data-backed decisions.
The bulk of our data scientists are heavy users of Jupyter Notebook. Jupyter notebooks are interactive computing environments that allow users to create and share documents containing live code, equations, visualizations, and narrative text.
Few actors in the modern data stack have inspired the enthusiasm and fervent support as dbt. This datatransformation tool enables data analysts and engineers to transform, test and document data in the cloud data warehouse. Curious to learn how the data catalog can power your data strategy?
We create the insert_orders_fact_tbl AWS Glue job manually using AWS Glue Visual Studio. You will see the message “Successfully connected to the data store with connection blog-redshift-connection.” Under Data Catalog in the navigation pane, choose Crawlers. Select Visual with a blank canvas , then choose Create.
For addressing data quality challenges in Amazon Simple Storage Service (Amazon S3) data lakes and data pipelines, AWS has announced AWS Glue Data Quality (preview). Stored procedures Stored procedures are commonly used to encapsulate logic for datatransformation, data validation, and business-specific logic.
Attempting to learn more about the role of big data (here taken to datasets of high volume, velocity, and variety) within business intelligence today, can sometimes create more confusion than it alleviates, as vital terms are used interchangeably instead of distinctly.
Many are subject matter experts for a particular kind of data, which enables them to spot anomalies in that data quickly, understand the root cause, and resolve the issue. Image Sourced from theproductmanager.com Further, they can quickly create helpful visualizations from the data they analyze. Here is her LinkedIn.
You can’t talk about data analytics without talking about data modeling. The reasons for this are simple: Before you can start analyzing data, huge datasets like data lakes must be modeled or transformed to be usable.
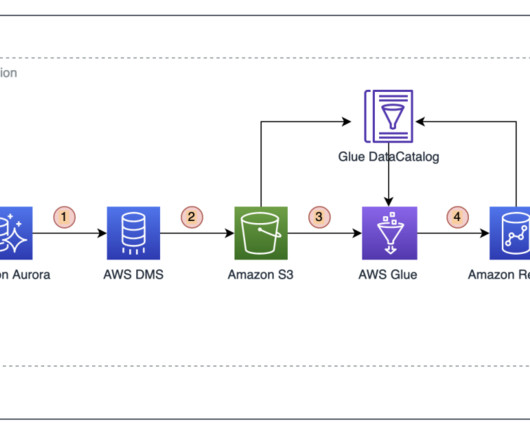
Data ingestion – Steps 1 and 2 use AWS DMS, which connects to the source database and moves full and incremental data (CDC) to Amazon S3 in Parquet format. Datatransformation – Steps 3 and 4 represent an EMR Serverless Spark application (Amazon EMR 6.9 For Name , enter emr-delta-blog. For Type , choose Spark.
We organize all of the trending information in your field so you don't have to. Join 42,000+ users and stay up to date on the latest articles your peers are reading.
You know about us, now we want to get to know you!
Let's personalize your content
Let's get even more personalized
We recognize your account from another site in our network, please click 'Send Email' below to continue with verifying your account and setting a password.


Let's personalize your content