This site uses cookies to improve your experience. To help us insure we adhere to various privacy regulations, please select your country/region of residence. If you do not select a country, we will assume you are from the United States. Select your Cookie Settings or view our Privacy Policy and Terms of Use.
Cookie Settings
Cookies and similar technologies are used on this website for proper function of the website, for tracking performance analytics and for marketing purposes. We and some of our third-party providers may use cookie data for various purposes. Please review the cookie settings below and choose your preference.
Used for the proper function of the website
Used for monitoring website traffic and interactions
Cookie Settings
Cookies and similar technologies are used on this website for proper function of the website, for tracking performance analytics and for marketing purposes. We and some of our third-party providers may use cookie data for various purposes. Please review the cookie settings below and choose your preference.
Strictly Necessary: Used for the proper function of the website
Performance/Analytics: Used for monitoring website traffic and interactions
Amazon DataZone is a data management service that makes it faster and easier for customers to catalog, discover, share, and govern data stored across AWS, on premises, and from third-party sources.
BMW’s ambition is to continuously accelerate innovation and improve decision-making across their global operations. To achieve this, they aimed to break down data silos and centralize data from various business units and countries into the BMW Cloud Data Hub (CDH).
A Drug Launch Case Study in the Amazing Efficiency of a Data Team Using DataOps How a Small Team Powered the Multi-Billion Dollar Acquisition of a Pharma Startup When launching a groundbreaking pharmaceutical product, the stakes and the rewards couldnt be higher. data engineers delivered over 100 lines of code and 1.5
The Race For Data Quality In A Medallion Architecture The Medallion architecture pattern is gaining traction among data teams. It is a layered approach to managing and transforming data. By systematically moving data through these layers, the Medallion architecture enhances the data structure in a data lakehouse environment.
This week on the keynote stages at AWS re:Invent 2024, you heard from Matt Garman, CEO, AWS, and Swami Sivasubramanian, VP of AI and Data, AWS, speak about the next generation of Amazon SageMaker , the center for all of your data, analytics, and AI. The relationship between analytics and AI is rapidly evolving.
Data is the most significant asset of any organization. However, enterprises often encounter challenges with data silos, insufficient access controls, poor governance, and quality issues. Embracing data as a product is the key to address these challenges and foster a data-driven culture.
Data exploded and became big. We all gained access to the cloud. Spreadsheets finally took a backseat to actionable and insightful data visualizations and interactive business dashboards. The rise of self-service analytics democratized the data product chain. 1) Data Quality Management (DQM).
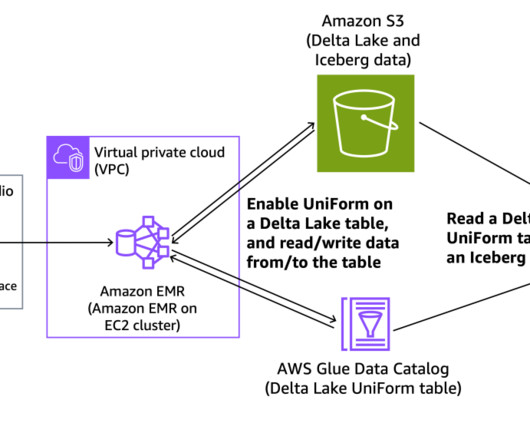
The landscape of big data management has been transformed by the rising popularity of open table formats such as Apache Iceberg, Apache Hudi, and Linux Foundation Delta Lake. These formats, designed to address the limitations of traditional data storage systems, have become essential in modern data architectures.
BI projects aren’t just for the big fishes in the sea anymore; the technology has developed rapidly, the software has become more accessible while business intelligence and analytics projects implemented in various industries regularly, no matter the shape and size, small businesses or large enterprises.
Snapshots are crucial for data backup and disaster recovery in Amazon OpenSearch Service. Snapshots play a critical role in providing the availability, integrity and ability to recover data in OpenSearch Service domains. Migration – Manual snapshots can be useful when you want to migrate data from one domain to another.
Amazon DataZone now launched authentication supports through the Amazon Athena JDBC driver, allowing data users to seamlessly query their subscribed data lake assets via popular business intelligence (BI) and analytics tools like Tableau, Power BI, Excel, SQL Workbench, DBeaver, and more.
2025 will be about the pursuit of near-term, bottom-line gains while competing for declining consumer loyalty and digital-first business buyers,” Sharyn Leaver, Forrester chief research officer, wrote in a blog post Tuesday. 40% of highly regulated enterprises will combine data and AI governance.
While customers can perform some basic analysis within their operational or transactional databases, many still need to build custom data pipelines that use batch or streaming jobs to extract, transform, and load (ETL) data into their data warehouse for more comprehensive analysis. or a later version) database.
“It is a capital mistake to theorize before one has data.”– Data is all around us. Data has changed our lives in many ways, helping to improve the processes, initiatives, and innovations of organizations across sectors through the power of insight. Let’s kick things off by asking the question: what is a data dashboard?
Organizational data is often fragmented across multiple lines of business, leading to inconsistent and sometimes duplicate datasets. This fragmentation can delay decision-making and erode trust in available data. This solution enhances governance and simplifies access to unstructured data assets across the organization.
With the growing emphasis on data, organizations are constantly seeking more efficient and agile ways to integrate their data, especially from a wide variety of applications. In addition, organizations rely on an increasingly diverse array of digital systems, data fragmentation has become a significant challenge.
Amazon SageMaker Unified Studio (preview) provides an integrated data and AI development environment within Amazon SageMaker. From the Unified Studio, you can collaborate and build faster using familiar AWS tools for model development, generative AI, data processing, and SQL analytics.
Amazon Redshift is a fast, scalable, secure, and fully managed cloud data warehouse that makes it simple and cost-effective to analyze your data using standard SQL and your existing business intelligence (BI) tools. Data ingestion is the process of getting data to Amazon Redshift.
A CRM dashboard is a centralized hub of information that presents customer relationship management data in a way that is dynamic, interactive, and offers access to a wealth of insights that can improve your consumer-facing strategies and communications. Let’s look at this in more detail. What Is A CRM Report?
The rise of innovative, interactive, data-driven dashboard tools has made creating effective dashboards – like the one featured above – swift, simple, and accessible to today’s forward-thinking businesses. Your business dashboard should be user-friendly and constitute a basic aid in the decision-making process.
Solution overview AWS AppSync creates serverless GraphQL and pub/sub APIs that simplify application development through a single endpoint to securely query, update, or publish data. GraphQL is a data language to enable client apps to fetch, change, and subscribe to data from servers.
We are excited to announce the acquisition of Octopai , a leading data lineage and catalog platform that provides data discovery and governance for enterprises to enhance their data-driven decision making.
Below is our third post (3 of 5) on combining data mesh with DataOps to foster greater innovation while addressing the challenges of a decentralized architecture. We’ve talked about data mesh in organizational terms (see our first post, “ What is a Data Mesh? ”) and how team structure supports agility. Source: Thoughtworks.
With so much responsibility and such little time, financial data analysis is no easy feat. But, while working efficiently with fiscal data was once a colossal challenge, we live in the digital age and have incredible solutions available to us. Torture the data, and it will confess to anything.”— What Is A CFO Report?
Amazon Redshift , launched in 2013, has undergone significant evolution since its inception, allowing customers to expand the horizons of data warehousing and SQL analytics. Industry-leading price-performance Amazon Redshift offers up to three times better price-performance than alternative cloud data warehouses.
“Software as a service” (SaaS) is becoming an increasingly viable choice for organizations looking for the accessibility and versatility of software solutions and online data analysis tools without the need to rely on installing and running applications on their own computer systems and data centers.
Big data plays a crucial role in online data analysis , business information, and intelligent reporting. Companies must adjust to the ambiguity of data, and act accordingly. Business intelligence reporting, or BI reporting, is the process of gathering data by utilizing different software and tools to extract relevant insights.
The term ‘big data’ alone has become something of a buzzword in recent times – and for good reason. By implementing the right reporting tools and understanding how to analyze as well as to measure your data accurately, you will be able to make the kind of data driven decisions that will drive your business forward.
Also, implementing effective management reports will create a data-driven approach to making business decisions and obtaining sustainable business success. Project dashboard software is also effective for interdepartmental collaboration due to its flexible access and usability. Centralized data.
Feature Development and Data Management: This phase focuses on the inputs to a machine learning product; defining the features in the data that are relevant, and building the data pipelines that fuel the machine learning engine powering the product. Tools like MLFlow are designed to help manage experimentation.
If you include the title of this blog, you were just presented with 13 examples of heteronyms in the preceding paragraphs. Specifically, in the modern era of massive data collections and exploding content repositories, we can no longer simply rely on keyword searches to be sufficient. Data catalogs are very useful and important.
“Big data is at the foundation of all the megatrends that are happening.” – Chris Lynch, big data expert. We live in a world saturated with data. Zettabytes of data are floating around in our digital universe, just waiting to be analyzed and explored, according to AnalyticsWeek. Wondering which data science book to read?
In a world focused on buzzword-driven models and algorithms, you’d be forgiven for forgetting about the unreasonable importance of data preparation and quality: your models are only as good as the data you feed them. Why is high-quality and accessibledata foundational? Re-analyzing existing data is often very bad.”
Previously, we discussed the top 19 big data books you need to read, followed by our rundown of the world’s top business intelligence books as well as our list of the best SQL books for beginners and intermediates. Data visualization, or ‘data viz’ as it’s commonly known, is the graphic presentation of data.
In recent years, analytical reporting has evolved into one of the world’s most important business intelligence components, compelling companies to adapt their strategies based on powerful data-driven insights. It is possible to structure data across a broad range of spreadsheets, but the final result can be more confusing than productive.
“Without big data, you are blind and deaf and in the middle of a freeway.” – Geoffrey Moore, management consultant, and author. In a world dominated by data, it’s more important than ever for businesses to understand how to extract every drop of value from the raft of digital insights available at their fingertips.
And to gain greater vision, you need to embrace the power of digital data. By leveraging smart online data analysis in the right way, you will gain access to insights that will help you develop strategies that foster growth and innovation while keeping your staff motivated, engaged, and happy. But how can you achieve this?
Customers often want to augment and enrich SAP source data with other non-SAP source data. Such analytic use cases can be enabled by building a data warehouse or data lake. Customers can now use the AWS Glue SAP OData connector to extract data from SAP.
In todays data-driven world, securely accessing, visualizing, and analyzing data is essential for making informed business decisions. For instance, a global sports gear company selling products across multiple regions needs to visualize its sales data, which includes country-level details.
Computer vision technology allows your smartphone camera, for instance, to decipher which element of the image it is capturing is a face, propelling technology such as Google Image Search to make decisions and deliver accurate results. Thus, deep nets can crunch unstructured data that was previously not available for unsupervised analysis.
Concerning professional growth, development, and evolution, using data-driven insights to formulate actionable strategies and implement valuable initiatives is essential. Data visualization methods refer to the creation of graphical representations of information. That’s where data visualization comes in.
They may gather financial, marketing and sales-related information, or more technical data; a business report sample will be your all-time assistance to adjust purchasing plans, staffing schedules, and more generally, communicating your ideas in the business environment. Let’s get started. Explore our 14-day free trial.
Management reporting is a source of business intelligence that helps business leaders make more accurate, data-driven decisions. By the end of this article, making stunning and useful managerial reports will be second nature to you. While such reports are useful for legal purposes, they’re not ideal for decision-making.
The data mesh design pattern breaks giant, monolithic enterprise data architectures into subsystems or domains, each managed by a dedicated team. DataOps helps the data mesh deliver greater business agility by enabling decentralized domains to work in concert. . But first, let’s define the data mesh design pattern.
We organize all of the trending information in your field so you don't have to. Join 42,000+ users and stay up to date on the latest articles your peers are reading.
You know about us, now we want to get to know you!
Let's personalize your content
Let's get even more personalized
We recognize your account from another site in our network, please click 'Send Email' below to continue with verifying your account and setting a password.


Let's personalize your content