This site uses cookies to improve your experience. To help us insure we adhere to various privacy regulations, please select your country/region of residence. If you do not select a country, we will assume you are from the United States. Select your Cookie Settings or view our Privacy Policy and Terms of Use.
Cookie Settings
Cookies and similar technologies are used on this website for proper function of the website, for tracking performance analytics and for marketing purposes. We and some of our third-party providers may use cookie data for various purposes. Please review the cookie settings below and choose your preference.
Used for the proper function of the website
Used for monitoring website traffic and interactions
Cookie Settings
Cookies and similar technologies are used on this website for proper function of the website, for tracking performance analytics and for marketing purposes. We and some of our third-party providers may use cookie data for various purposes. Please review the cookie settings below and choose your preference.
Strictly Necessary: Used for the proper function of the website
Performance/Analytics: Used for monitoring website traffic and interactions
A Drug Launch Case Study in the Amazing Efficiency of a Data Team Using DataOps How a Small Team Powered the Multi-Billion Dollar Acquisition of a Pharma Startup When launching a groundbreaking pharmaceutical product, the stakes and the rewards couldnt be higher. data engineers delivered over 100 lines of code and 1.5
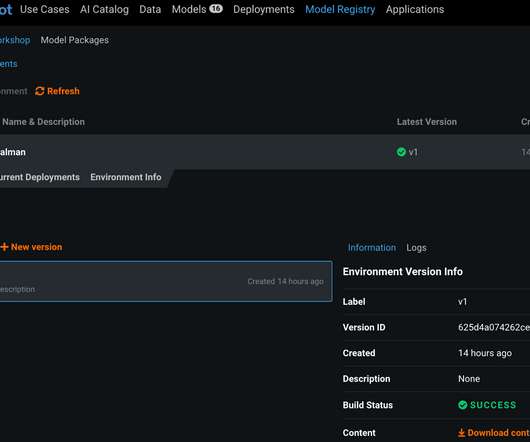
Amazon DataZone is a data management service that makes it faster and easier for customers to catalog, discover, share, and govern data stored across AWS, on premises, and from third-party sources. This new JDBC connectivity feature enables our governed data to flow seamlessly into these tools, supporting productivity across our teams.”
The Race For Data Quality In A Medallion Architecture The Medallion architecture pattern is gaining traction among data teams. It is a layered approach to managing and transforming data. By systematically moving data through these layers, the Medallion architecture enhances the data structure in a data lakehouse environment.
Below is our third post (3 of 5) on combining data mesh with DataOps to foster greater innovation while addressing the challenges of a decentralized architecture. We’ve talked about data mesh in organizational terms (see our first post, “ What is a Data Mesh? ”) and how team structure supports agility. Source: Thoughtworks.
DataOps has become an essential methodology in pharmaceutical enterprise data organizations, especially for commercial operations. Companies that implement it well derive significant competitive advantage from their superior ability to manage and create value from data.
Data exploded and became big. Spreadsheets finally took a backseat to actionable and insightful data visualizations and interactive business dashboards. The rise of self-service analytics democratized the data product chain. 1) Data Quality Management (DQM). We all gained access to the cloud.
Already many companies are using machine learning in a variety of exciting ways. Data management is driven by machine learning. Merging machine learning with masterdata management solutions is creating remarkable changes in the business world. Here are five ways machine learning is changing business operations.
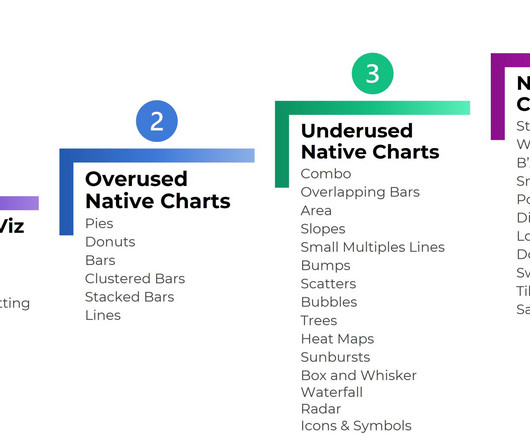
Previously, we discussed the top 19 big data books you need to read, followed by our rundown of the world’s top business intelligence books as well as our list of the best SQL books for beginners and intermediates. Data visualization, or ‘data viz’ as it’s commonly known, is the graphic presentation of data.
Data organizations often have a mix of centralized and decentralized activity. DataOps concerns itself with the complex flow of data across teams, data centers and organizational boundaries. It expands beyond tools and data architecture and views the data organization from the perspective of its processes and workflows.
What is Data Modeling? Data modeling is a process that enables organizations to discover, design, visualize, standardize and deploy high-quality data assets through an intuitive, graphical interface. Data models provide visualization, create additional metadata and standardize data design across the enterprise.
The release of Cloudera Data Platform (CDP) Private Cloud Base edition provides customers with a next generation hybrid cloud architecture. Traditional data clusters for workloads not ready for cloud. Each role is classified as follows: Master. In clusters of more than 200 nodes, five master nodes may be appropriate.
Predictive analytics is the practice of extracting information from existing data sets in order to forecast future probabilities. Applied to business, it is used to analyze current and historical data in order to better understand customers, products, and partners and to identify potential risks and opportunities for a company.
28 blog posts. Here are our favorite 21 data visualization resources from the past year. Knowing your audience” is terrible data visualization advice. In this blog post, you’ll learn 8 specific, nuanced, advanced ways of “knowing our audience.”. Better Storytelling with the Same Data: Upgrade that Board Packet!
At the Masters®, storied tradition meets state-of-the-art technology. Through a partnership spanning more than 25 years, IBM has helped the Augusta National Golf Club capture, analyze, distribute and use data to bring fans closer to the action, culminating in the AI-powered Masters digital experience and mobile app.
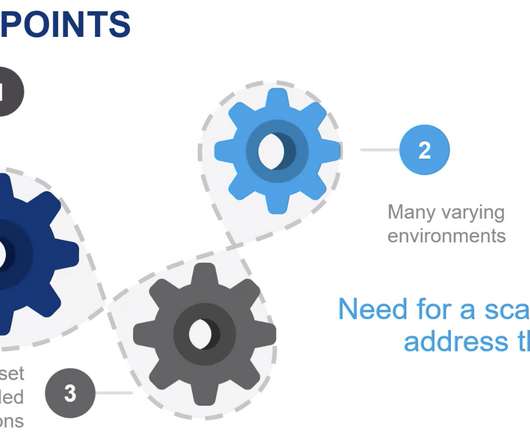
Distributed computing frameworks often require the creation of a set of machines that work with one another to perform some sort of large-scale data processing. This cluster of computing resources can be provided through a variety of services. pem files) and other concepts. pem files) and other concepts.
For years IBM has been using cutting-edge AI to improve the digital experiences found in the Masters app. We taught an AI model to analyze Masters video and produce highlight reels for every player, minutes after their round is complete. I think the AI Commentary capability in the Masters app offers some answers.
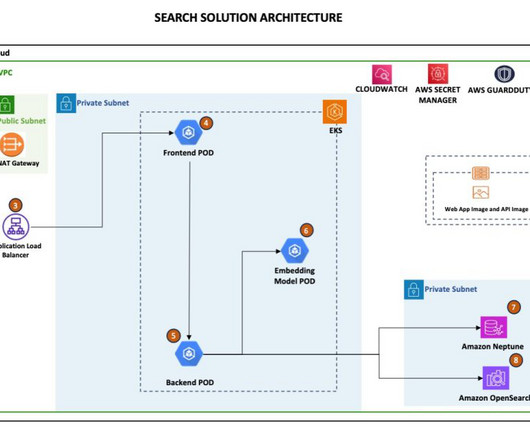
In this blog post, we will highlight how ZS Associates used multiple AWS services to build a highly scalable, highly performant, clinical document search platform. We use leading-edge analytics, data, and science to help clients make intelligent decisions. Overview of solution The solution was designed in layers.
Most of what is written though has to do with the enabling technology platforms (cloud or edge or point solutions like data warehouses) or use cases that are driving these benefits (predictive analytics applied to preventive maintenance, financial institution’s fraud detection, or predictive health monitoring as examples) not the underlying data.
“BI is about providing the right data at the right time to the right people so that they can take the right decisions” – Nic Smith. Data analytics isn’t just for the Big Guys anymore; it’s accessible to ventures, organizations, and businesses of all shapes, sizes, and sectors. And the success stories are seemingly endless.
I have blogged in the past on the importance of data in our AI-infused world emerging around us – see Microsoft Targets Mother of All Professional-People MasterData with LinkedIn Buy. We are not yet talking about rare data or synthetic data. Data wins, ultimately. So, there you have it.
Like most of our customers, Cloudera’s internal operations rely heavily on data. For more than a decade, Cloudera has built internal tools and data analysis primarily on a single production CDH cluster. In this blog, we discuss our journey to CDP for this critical cluster. Our Internal Environment Before Upgrade.
Pre-upgrade considerations, such as compatibility issues and tools you can utilize to collect important data on your environment to assist with the upgrade. A wide variety of additional resources to discover more and continue planning your upgrade to vSphere 6.7 Step-by-step process and guide through the actual upgrade.
OpenSearch also includes capabilities to ingest and analyze data. This blog post dives into the strategic considerations and steps involved in migrating from Solr to OpenSearch. As part of the migration, reconsider your data model. Poor data modeling doesn’t only result in search performance problems but extends to other areas.
3) The Link Between White Label BI & Embedded Analytics 4) An Embedded BI Workflow Example 5) White Labeled Embedded BI Examples In the modern world of business, data holds the key to success. That said, data and analytics are only valuable if you know how to use them to your advantage. million per year.
If we can crack the nut of enabling a wider workforce to build AI solutions, we can start to realize the promise of data science. Transferring knowledge between data scientists and data experts (in both directions) is critical and may soon lend itself to a new view of citizen data science. Deep Learning Trends from GTC21.
Cloudera has appointed Remus Lim as vice president of Asia Pacific and Japan, to drive adoption of the hybrid data platform across the region and support customers in their journey to become more data-driven. Data volumes and data sources continue to expand at breakneck speed.
Data modeling supports collaboration among business stakeholders – with different job roles and skills – to coordinate with business objectives. Data resides everywhere in a business , on-premise and in private or public clouds. A single source of data truth helps companies begin to leverage data as a strategic asset.
The Semantic Web, both as a research field and a technology stack, is seeing mainstream industry interest, especially with the knowledge graph concept emerging as a pillar for data well and efficiently managed. And what are the commercial implications of semantic technologies for enterprise data? Source: tag.ontotext.com.
For those who master the art of delivering a modern customer experience, there are huge rewards. By using data to listen to their customers better. The most innovative companies use data and analytics to offer appropriate products and services. How can financial institutions improve the customer experience?
YouTubing , blogging , and speaking at conferences just for fun quickly transformed into a fulfilling, creative business that’s taken me all over the world and enabled me to work with dream organizations. I never intended to start a business; it just kind of happened naturally thanks to YouTubing and blogging. I loved your talk!”
But it has enriched us in terms of identifying key needs for those looking to build a simple prototype in order to demonstrate the power of semantic technology, linked data and knowledge graphs. Some of that journey has been recorded in a previous blog post. This training will not make a SPARQL master out of anyone.
Data catalogs have quickly become a core component of modern data management. Organizations with successful data catalog implementations see remarkable changes in the speed and quality of data analysis, and in the engagement and enthusiasm of people who need to perform data analysis. Why do we need a data catalog?
We are going to talk about auditing, different security levels, security features of Data Catalog, and Client Considerations. Access audits are mastered centrally in Apache Ranger which provides comprehensive non-repudiable audit log for every access event to every resource with rich access event metadata such as: IP. Data Catalog .
compliance with the General Data Protection Regulation). Accelerating the retrieval and analysis of data —so much of it unstructured—is vital to becoming a data-driven business that can effectively respond in real time to customers, partners, suppliers and other parties, and profit from these efforts. Comparing SQL and NoSQL.
4 Levels of Excel Vizardry I’ve taught data visualization in Excel a dozen different ways over the years. Level 1: Exploratory Viz We can make sparklines, data bars, and heat tables within seconds. I’ve blogged about these skills over and over and over because they’re the perfect launchpad. First, dip a toe in.
Thousands of customers rely on Amazon Redshift to build data warehouses to accelerate time to insights with fast, simple, and secure analytics at scale and analyze data from terabytes to petabytes by running complex analytical queries. The star schema is a popular data model for building data marts.
The global pandemic has driven home the fact that data is vital to the success of every organization. Sisense recently surveyed over 460 companies across Australia and New Zealand to dig into their data and analytics usage and future plans. Who is leading the way?
This year, innovation at the US Open was facilitated and accelerated by watsonx , IBM’s new AI and data platform for the enterprise. In another major sporting event partnership, IBM and the Masters® built a digital platform to scale the capabilities of the Masters Digital team.
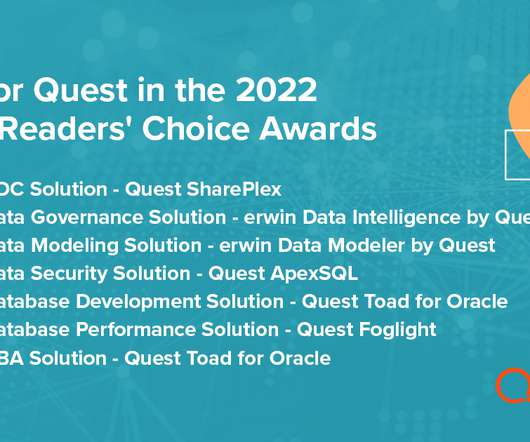
Best Data Governance Solution (erwin Data Intelligence). Best Data Modeling Solution (erwin Data Modeler). Best Data Security Solution (Quest ApexSQL). In data warehousing, the data is extracted and transported from production database(s) into a data warehouse for reporting and analysis.
This article presents a case study of how DataRobot was able to achieve high accuracy and low cost by actually using techniques learned through Data Science Competitions in the process of solving a DataRobot customer’s problem. While there are many differences between Data Science Competitions and business, there are also similarities.
This is a much belated follow up to my very first blog post Open Your Mind To Business Intelligence from 4 years ago. Unfortunately all of the linked Channel 9 videos in that blog post are no longer available. Chapter 3 Selecting the Data Architecture that Fits Your Organization. Chapter 9 Discovering Knowledge with Data Mining.
This is a much belated follow up to my very first blog post Open Your Mind To Business Intelligence from 4 years ago. Unfortunately all of the linked Channel 9 videos in that blog post are no longer available. Chapter 3 Selecting the Data Architecture that Fits Your Organization. Chapter 9 Discovering Knowledge with Data Mining.
Web Intelligence, IDT Universe Design, BusinessObjects administration, Dashboard design and data visualization. Wednesday June 24: BI Dashboards and Data Visualization. SQL for Data Analysts: Beginner/Intermediate. Mastering Tableau in Two Days. SQL for Data Analysts: Advanced. IDT in a Day.
In this blog post, Sheryl outlines how next-gen CIP applications are delivering a better customer experience, and why businesses are relying on CIPs as their preferred path to customer insights. Structured data from operational data stores now provides a small slice of the overall data needed to improve customer experience.
We organize all of the trending information in your field so you don't have to. Join 42,000+ users and stay up to date on the latest articles your peers are reading.
You know about us, now we want to get to know you!
Let's personalize your content
Let's get even more personalized
We recognize your account from another site in our network, please click 'Send Email' below to continue with verifying your account and setting a password.


Let's personalize your content