This site uses cookies to improve your experience. To help us insure we adhere to various privacy regulations, please select your country/region of residence. If you do not select a country, we will assume you are from the United States. Select your Cookie Settings or view our Privacy Policy and Terms of Use.
Cookie Settings
Cookies and similar technologies are used on this website for proper function of the website, for tracking performance analytics and for marketing purposes. We and some of our third-party providers may use cookie data for various purposes. Please review the cookie settings below and choose your preference.
Used for the proper function of the website
Used for monitoring website traffic and interactions
Cookie Settings
Cookies and similar technologies are used on this website for proper function of the website, for tracking performance analytics and for marketing purposes. We and some of our third-party providers may use cookie data for various purposes. Please review the cookie settings below and choose your preference.
Strictly Necessary: Used for the proper function of the website
Performance/Analytics: Used for monitoring website traffic and interactions
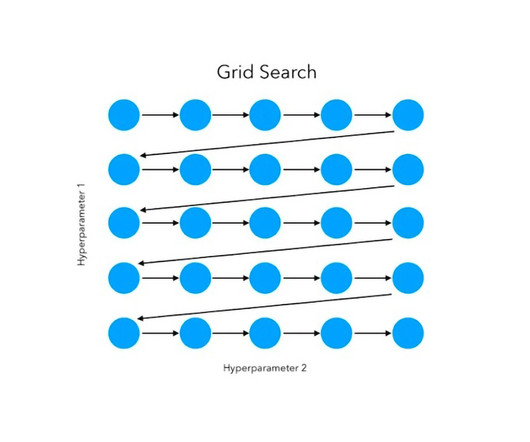
Hyperparameter optimization—adjusting those settings to end up with something that’s not horrible—might be the most important part of it all. Introduction One of the toughest things about making powerful models in machine learning is fiddling with many levels.
This article was published as a part of the Data Science Blogathon Dear readers, In this blog, we will build a random forest classifier(RFClassifier) model to detect breast cancer using this dataset from Kaggle. The post A Hands-On Discussion on Hyperparameter Optimization Techniques appeared first on Analytics Vidhya.
Introduction In deep learning, the Adam optimizer has become a go-to algorithm for many practitioners. In this blog, we’ll dive into the intricacies […] The post What is Adam Optimizer and How to Tune its Parameters in PyTorch appeared first on Analytics Vidhya.
The most ideal way to optimize for Image SEO is to write updated ALT tags of your images on the site. A good graphical abstract personifying your blog’s message will be invaluable. A good graphical abstract personifying your blog’s message will be invaluable. Plus, make sure your image is relevant. Closing Remarks.
With a goal to help data science teams learn about the application of AI and ML, DataRobot shares helpful, educational blogs based on work with the world’s most strategic companies. Explore these 10 popular blogs that help data scientists drive better data decisions. Read the blog. Read the blog. Read the blog.
By providing real-time visibility into the performance and behavior of data-related systems, DataOps observability enables organizations to identify and address issues before they become critical, and to optimize their data-related workflows for maximum efficiency and effectiveness.
EY, in a recent blog post focused on top opportunities for IT companies in 2025, recommends money raised from these activities be used on AI projects. Divestitures can also help companies zero in on their potential and market relevance, the blog authors note.
Introduction Predicting patient outcomes is critical to healthcare management, enabling hospitals to optimize resources and improve patient care. Machine learning algorithms or deep learning techniques have proven valuable in survival prediction rates, offering insights that can help guide treatment plans and prioritize resources.
2025 will be about the pursuit of near-term, bottom-line gains while competing for declining consumer loyalty and digital-first business buyers,” Sharyn Leaver, Forrester chief research officer, wrote in a blog post Tuesday. Some leaders will pursue that goal strategically, in ways that set up their organizations for long-term success.
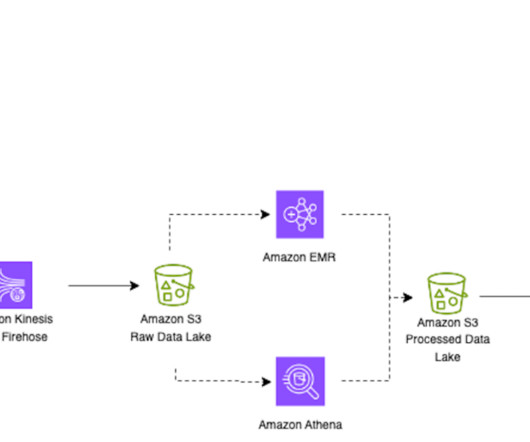
This blog dives into the remarkable journey of a data team that achieved unparalleled efficiency using DataOps principles and software that transformed their analytics and data teams into a hyper-efficient powerhouse. The following diagram shows the relationships between the key systems.
Systems of this nature generate a huge number of small objects and need attention to compact them to a more optimal size for faster reading, such as 128 MB, 256 MB, or 512 MB. As of this writing, only the optimize-data optimization is supported. To check how to create an Amazon S3 bucket, follow the instructions given here.
First query response times for dashboard queries have significantly improved by optimizing code execution and reducing compilation overhead. We have enhanced autonomics algorithms to generate and implement smarter and quicker optimal data layout recommendations for distribution and sort keys, further optimizing performance.
Learn how to automate and reclaim valuable time with generative AI-powered assistants The post AI assistants optimize automation with API-based agents appeared first on IBM Blog. By leveraging AI assistants, enterprises can accelerate their automation initiatives and redeploy significant resources toward more value-generating areas.
This is a guest blog post co-authored with Atul Khare and Bhupender Panwar from Salesforce. In this post, we discuss how the Salesforce TIP team optimized their architecture using Amazon Web Services (AWS) managed services to achieve better scalability, cost, and operational efficiency. Headquartered in San Francisco, Salesforce, Inc.
You can use big data analytics in logistics, for instance, to optimize routing, improve factory processes, and create razor-sharp efficiency across the entire supply chain. This isn’t just valuable for the customer – it allows logistics companies to see patterns at play that can be used to optimize their delivery strategies.
Register now for our webinar on AI, automation and API security Learn more about the IBM partnership with Noname Security The post Optimize APIs with API security best practices appeared first on IBM Blog.
As we have already talked about in our previous blog post on sales reports for daily, weekly or monthly reporting, you need to figure out a couple of things when launching and executing a marketing campaign: are your efforts paying off? 1) Blog Traffic And Blog Leads Report. click to enlarge**.
In this post, we examine the OR1 instance type, an OpenSearch optimized instance introduced on November 29, 2023. To learn more about OR1, see the introductory blog post. Goal In this blog post, we’ll explore how OR1 impacts the performance of OpenSearch workloads. MiB per bulk (uncompressed).
Marketing gaining precise insights into ROI, allowing them to optimize ad spend and refine campaign strategies With such integration, you can expect measurable improvements, as decisions are made based on a single, reliable source of truth rather than disconnected reports. Well keep you in the loop on all things data!
With updated TestGen 3.0 , you have the power to score, monitor, and optimize your data quality like never before. Better Metadata Management Add Descriptions and Data Product tags to tables and columns in the Data Catalog for improved governance. DataOps just got more intelligent. Upgrade today and take control of your data quality!
Use case Amazon DataZone addresses your data sharing challenges and optimizes data availability. Refer to the detailed blog post on how you can use this to connect through various other tools. Check out the video below and the detailed blog post to learn how to connect Amazon DataZone to external analytics tools via JDBC.
There are excellent summaries of these failures in Ben Thompson’s newsletter Stratechery and Simon Willison’s blog. You can train models that are optimized to be correct—but that’s a different kind of model. Of course, Bard and Sydney are beta releases that aren’t open to the wider public yet.
In our cutthroat digital economy, massive amounts of data are gathered, stored, analyzed, and optimized to deliver the best possible experience to customers and partners. At the same time, inventory metrics are needed to help managers and professionals in reaching established goals, optimizing processes, and increasing business value.
Adopting hybrid and multi-cloud models provides enterprises with flexibility, cost optimization, and a way to avoid vendor lock-in. Cost Savings: Hybrid and multi-cloud setups allow organizations to optimize workloads by selecting cost-effective platforms, reducing overall infrastructure costs while meeting performance needs.
With a powerful dashboard maker , each point of your customer relations can be optimized to maximize your performance while bringing various additional benefits to the picture. Whether you’re looking at consumer management dashboards and reports, every CRM dashboard template you use should be optimal in terms of design.
Amazon EMR on EC2 , Amazon EMR Serverless , Amazon EMR on Amazon EKS , Amazon EMR on AWS Outposts and AWS Glue all use the optimized runtimes. This is a further 32% increase from the optimizations shipped in Amazon EMR 7.1 In this post, we demonstrate the performance benefits of using the Amazon EMR 7.5 with Iceberg 1.6.1
AI optimizes business processes, increasing productivity and efficiency while automating repetitive tasks and supporting human capabilities. Others are solely company-focused, and 11% of the primary players don’t even operate a blog, according to Callbox. 2) Vertical SaaS. Astonishingly low figures by all accounts.
That’s why it’s critical to monitor and optimize relevant supply chain metrics. While there are numerous KPI examples you can select for your assessment and optimization, we have focused on a list that will enable you to identify potential bottlenecks and ensure sustainable development. Delivery Time.
CFO-centric dashboards and CFO report templates work cohesively to deliver metrics and insights that will optimize your business’s key financial activities in every area. Once you have set your aims, goals, and outcomes, you will be able to select CFO dashboard KPIs that will help you optimize your efforts. Ronald Coase.
The adoption of open table formats is a crucial consideration for organizations looking to optimize their data management practices and extract maximum value from their data. The AWS Glue Data Catalog addresses these challenges through its managed storage optimization feature. In earlier posts, we discussed AWS Glue 5.0
The post Cloudera Evaluates Integrated Data and AI Exchange Business Line to Optimize Data-Driven Generative AI Use Cases appeared first on Cloudera Blog. For enterprises looking to work and participate in the evaluation process, learn more about how to get involved here.
Likes, comments, shares, reach, CTR, conversions – all have become extremely significant to optimize and manage regularly in order to grow in our competitive digital environment. Here you might want to consider what kind of chart you want to use, whether you need to respect your brand colors, or even optimize for mobile devices.
Read the complete blog below for a more detailed description of the vendors and their capabilities. Observe, optimize, and scale enterprise data pipelines. . DataMo – Datmo tools help you seamlessly deploy and manage models in a scalable, reliable, and cost-optimized way. Download the 2021 DataOps Vendor Landscape here.
A COO (chief operating officer) dashboard is a visual management tool used by COOs to connect multiple data sources, track, evaluate, and help COOs to optimize operational processes within a company by using interactive metrics and advanced analytical capabilities. What Is A COO Dashboard? Let’s start with the transportation dashboard.
” Reflecting on these two paradigms provides clarity for data engineering leadership on how best to structure, empower, and optimize their teamstransitioning toward a process-centric approachthough challengingis achievable and yields significant benefits in data quality, operational efficiency, and team satisfaction.
Business intelligence (BI) is a term that relates to the applications, infrastructure, practices, and tools that empower businesses to access a broad range of analytical data for improvement, campaign optimization , and enhanced decision-making that maximizes performance. This can affect your ability to focus. Average order size.
Prescriptive analytics can help you optimize scheduling, production, inventory, and supply chain design to deliver what your customers want in the most optimized way. Building advanced analytics models that can optimize outcomes is one of the latest BI trends that will shape the future of BI. 1 for data analytics trends in 2020.
High-velocity workloads like network data are best managed on-premises, where operators have more control and can optimize costs. Carriers need tools that enable them to monitor performance, optimize workload distribution, and ensure data governance across both on-premises and cloud environments.
The models in the Garden are already optimized for running efficiently on Google’s Cloud infrastructure, offering cost effective inference and enterprise-grade scaling, even on the highest-throughput apps. Stay tuned for future AMPs well build using Cloudera AI and Vertex AI.
They keep your operations on schedule: While there are metrics examples that focus on strategic initiatives, as we mentioned, they will also help you in measuring day-to-day or weekly activities, which, in turn, will help you in keeping your operations on schedule and optimize them to improve results. IT: Average Handle Time.
This enables the line of business (LOB) to better understand their core business drivers so they can maximize sales, reduce costs, and further grow and optimize their business. Solution overview Let’s consider TICKIT , a fictional website where users buy and sell tickets online for sporting events, shows, and concerts.
In this blog, we will define Pandas and provide an example of how you can vectorize your Python code to optimize dataset analysis using Pandas to speed up your code over 300x times faster.
Important considerations for preview As you begin using automated Spark upgrades during the preview period, there are several important aspects to consider for optimal usage of the service: Service scope and limitations – The preview release focuses on PySpark code upgrades from AWS Glue versions 2.0 option("recursiveFileLookup", "true").option("path",
AI Co-pilot: The co-pilot empowers data teams with a real-time, unified workspace that automates, optimizes, and interprets scripts while providing immediate insights into data lineage. The post Octopai Acquisition Enhances Metadata Management to Trust Data Across Entire Data Estate appeared first on Cloudera Blog.
We organize all of the trending information in your field so you don't have to. Join 42,000+ users and stay up to date on the latest articles your peers are reading.
You know about us, now we want to get to know you!
Let's personalize your content
Let's get even more personalized
We recognize your account from another site in our network, please click 'Send Email' below to continue with verifying your account and setting a password.


Let's personalize your content